The challenge when looking at commodity prices is to identify and then disentangle quantifiable effects, such as a trend in supply or changes in other correlated commodities. This article takes a look at the relationship between changes in apparel fibre prices and supply during the past decade.
Commentary on the wool market is often made without reference to changes in the supply of wool (something the grains market would not do) and also to changes in correlated markets, which are primarily the other apparel fibre markets. This is of importance as some of these correlated markets dwarf the wool market and therefore will have some influence over the general cycles, trends and price levels seen in the raw wool markets.
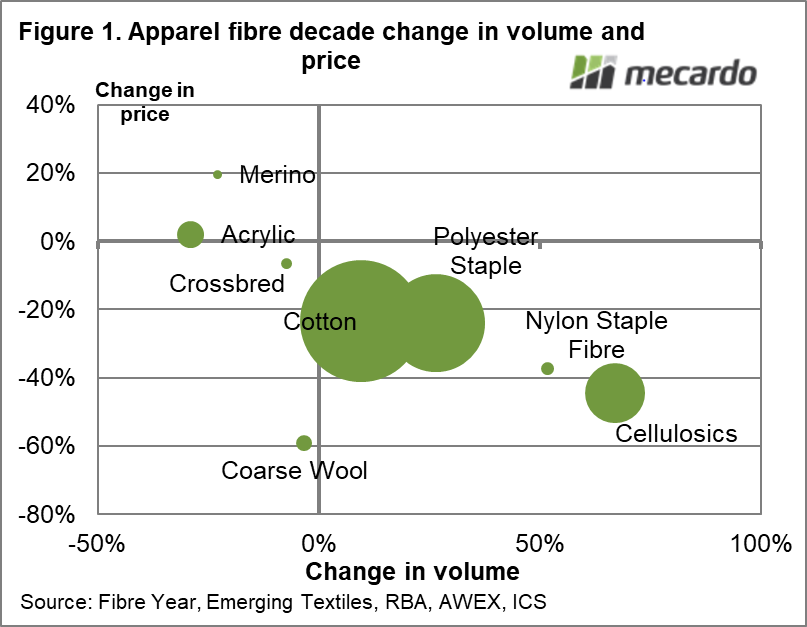
Figure 1 looks at the change in supply and price for a range of apparel fibres across the past decade (smoothed by three years). The change in supply is shown along the horizontal axis and the change in (US dollar) price is shown along the vertical axis. The size of the circles reflects the relative supply for each fibre, the bigger the circle the greater the volume. Cotton and polyester staple are the largest fibres considered here by a long way, followed by the cellulosics. The smaller fibres by volume are acrylic, coarse wool, crossbred, merino and nylon staple fibre. As a general rule, the fibres which have seen increased volumes during the past decade have also seen falls in price. Coarse crossbred wool is major exception, where the price has collapsed despite a small fall in supply. The position of merino fits, in that price has risen as supply has fallen.
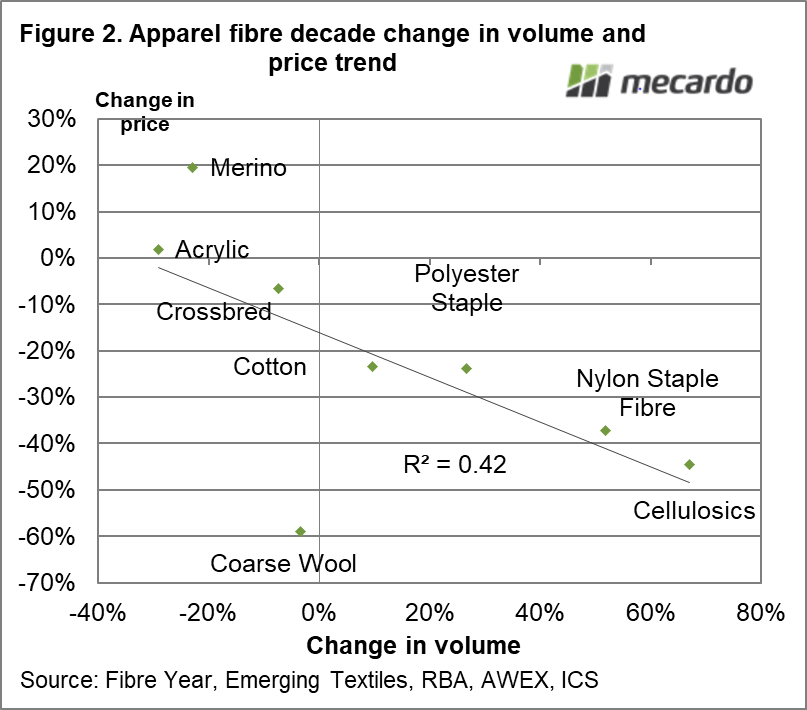
In Figure 2 a trend line has been fitted to the change in supply and price data for the apparel fibres. While there is variation about the trend line, it does illustrate the point that change in supply is a major factor on price in the longer run. The falling supply of merino wool compared to the rising supply of cotton has increased the price ratio of merino to cotton as shown by Mecardo last year. In this case supply was working in two ways – putting downward pressure on cotton price and upward pressure on the merino price.
As Figure 2 stands, the change in supply over the decade explains nearly half of the change in price. Remove the coarse wool outlier, and change in supply explains nearly 90% of change in price level.

What does it mean?
No claim about wool prices should be made without first allowing for the longer term changes in supply and then the movements of correlated fibre prices. It is a messy process. It is far easier to ignore supply and the other apparel fibres when discussing wool prices, and also potentially quite misleading. The merino market in recent decades has bought higher prices and higher price ratios to the major apparel fibres through lower supply.
Have any questions or comments?
Key Points
- When looking at change in price over the longer term, change in supply is an important factor to take into consideration accounting for up to 90% of the trend change in price.
- Supply becomes even more important when there are different trends in place for the various fibres, which impacts on the relative prices of the fibres (the price ratios).
Click on figure to expand
Click on figure to expand
Data sources: Fibre Year, Emerging Textiles, RBA, AWEX, ICS, Mecardo
