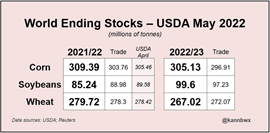
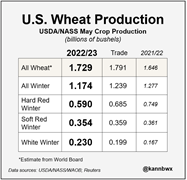
The USDA released their world stocks demand estimates last night and quietly put a bomb under the wheat market. Corn and bean stocks came in above trade expectations which set a tone for a lower pricing during the night, but all the attention focused on wheat, where global ending stocks shrank more than the trade estimated. (table 2) The knockout punch though came with the new crop US wheat production figures that really sent the market flying. (table 3)
All winter wheat production was under trade estimates, ultimately dragged down by the HRW wheat class (Kansas, Oklahoma, Texas etc) and is thought the be the lowest production number since 1963. We knew this area was struggling but these numbers caught the market off guard.
Spring wheat (North/South Dakota, Nebraska etc) will be assessed next WASDE update. This report will be under the microscope as well because the spring wheat classes will need to outperform in order to meet trend line yields, bearing in mind that seeding is well behind schedule.
Other notable estimates include:
- Brazilian corn steady at 116mmt.
- Russian wheat at 80mmt, with exports at 39mmt.
- Canadian wheat at 30mmt versus 21mmt last year.
- Ukrainian corn production at 19.5mmt, down from 42mmt last year, with exports around 9mmt. This is going to need a lot of things to go right for this to happen.
- Global wheat stocks to use at 14.6% (exc China), the lowest since 2006/07 which was 14.3%.
The savage nature of the wheat adjustments seems a little un-USDA like. They tend to make many small, incremental changes over time. With corn and soybean sowing experiencing sowing delays, I think we can expect a few more adjustments to come.

The week ahead….
There is going to be a lot more adjustment made to an ag market that is on a precipice. Delayed corn and wheat sowing in the US, dry Brazil, Canada too wet/too dry (depending where you are), Ukraine…. This market is a powder keg with any number of fuses waiting to be lit.
Have any questions or comments?
Click on graph to expand
Click on graph to expand
Click on graph to expand
Data sources: Reuters, USDA, K Braun
