Looking into the future is always a fraught activity, and is even more so with the COVID-19 pandemic playing out across the world. It is natural to project recent experience into the future. However with regard to apparel fibre prices at some stage the pandemic will pass (we will bypass the important question of when) and underlying demand conditions will change, again. This article takes a look at trends in apparel fibre prices during the past 60 years, which may help predict wool price trends in a post-pandemic world.l
In this article we will focus on the average merino micron price, keeping in mind that “wools ain’t wools” – there are wools other than merino. The same principle applies for the other two fibres considered in this article – cotton and polyester staple fibre (PSF).
Figure 1 shows annual deflated price series in US dollar terms from 1960 for merino (right hand scale), cotton and PSF (left hand scale). Keep in mind that in the early 1960s PSF was a young fibre, with cumulative historical production doubling every couple of years. The deflated price of PSF dropped like a stone through the 1960s (by around 80%) putting enormous downward pressure on other apparel fibre prices.
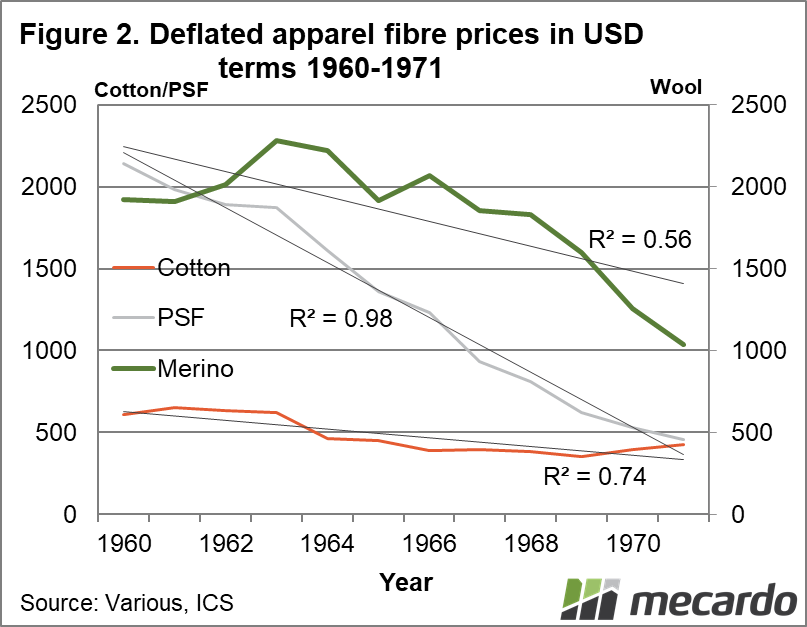
Figure 2 looks at the series shown in Figure 1 for the period 1960 through to 1971. Linear trends along with regression coefficients are shown for each series. The PSF price is nearly a straight line, with cotton having a strong downward trend and merino having the weakest downward trend. Deflated cotton and merino prices fell during the decade by the order of 40-50%, with wool prices showing the greatest variation around its trend.
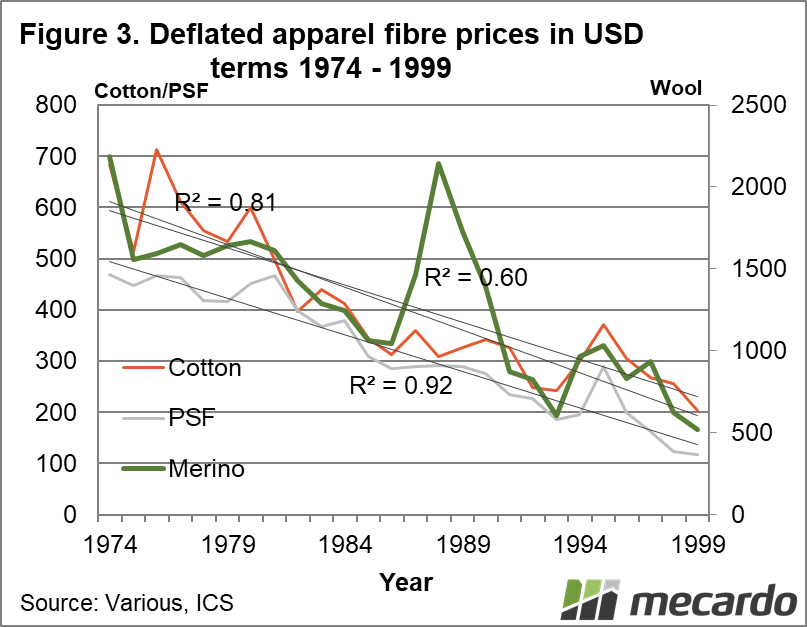
The next schematic in Figure 3 looks at the apparel fibre prices in the period 1974 to 1999. During this period the three fibres are shared a very similar downtrend, falling in deflated US dollar terms by 70-80%. During this period, again, wool had the greatest variability around the trend with a regression coefficient of 0.6 versus 0.8-0.9 for the other two fibres. Wool followed the general trend with more time away from the trend.
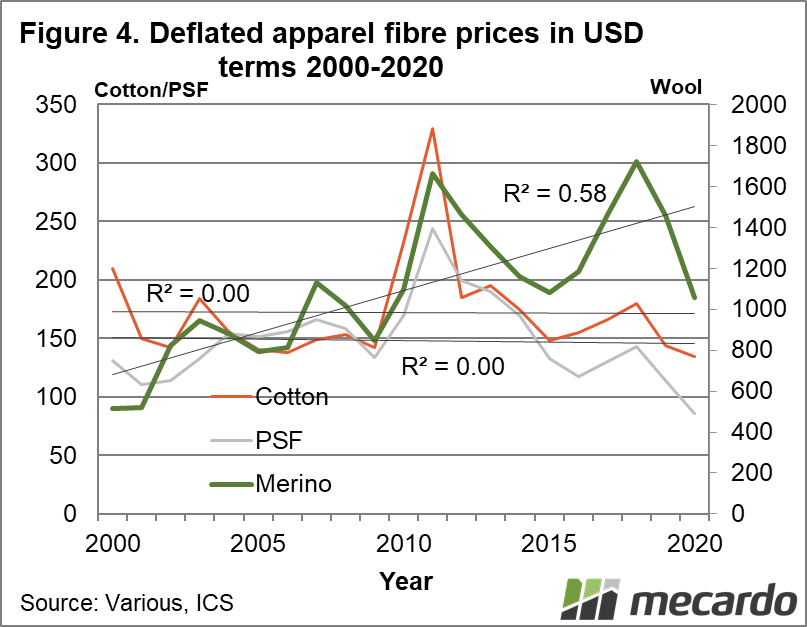
In Figure 4 the analysis is repeated for the past 20 years. If you go back to Figure 1 you will see that merino reached a low point around 2000, at the end of a period of depressed fibre prices and the final liquidation of the RPS stockpile. Fine merino prices had a different experience with this period a time of high prices. Back to Figure 4. In the past 20 years the merino price has trended up, while there has been no trends in either the cotton nor PSF prices – prices for these fibres has been flat. Once again the merino price has varied around the trend with a regression coefficient of 0.58. Merino prices are volatile, as we are seeing at present with prices well down on the trend of the past two decades.
The rising trend in merino prices matches that of lamb in the past couple of decades, which suggest the two commodities are responding to a common factor – namely lower sheep numbers, hence supply around the world. That bodes well for life in the post-pandemic world.

What does it mean?
Falling supply in absolute terms and relative to the supply of major fibres such as cotton, have been correlated with increased wool price ratios to these other fibres. With the prices for cotton and PSF flat lining, the increased price ratios have shown up as a rising trend in price in recent decades. While the trend is positive wool does have the loosest relationship of the three fibres shown with its trend, so prices tend to be more volatile as we have seen in recent years on both the upside and now the downside.
Have any questions or comments?
Key Points
- Unlike the period between 1960 and 1999, since 2000, merino prices in deflated US dollar terms have trended higher.
- During this period prices for deflated cotton and PSF have been flat, which is a change from the falling trend of the preceding 40 years.
- Lower supply looks to have fed into the rising trend for merino wool, aided by flat lining cotton and PSF prices.

Click on graph to expand
Click on graph to expand
Click on graph to expand
Click on graph to expand
Data sources: RBA, PCI Wood MacKenzie, Emerging Markets, Cotlook, BAE, AWC. WI. AWEX, US Federal Reserve , ICS, Mecardo


