
While vegetable fault (VM) levels have not risen greatly, they remain at high levels with the bigger increases in recent months taking place in the finer Merino micron categories. This article takes a look at current, as of last week, discounts for VM.
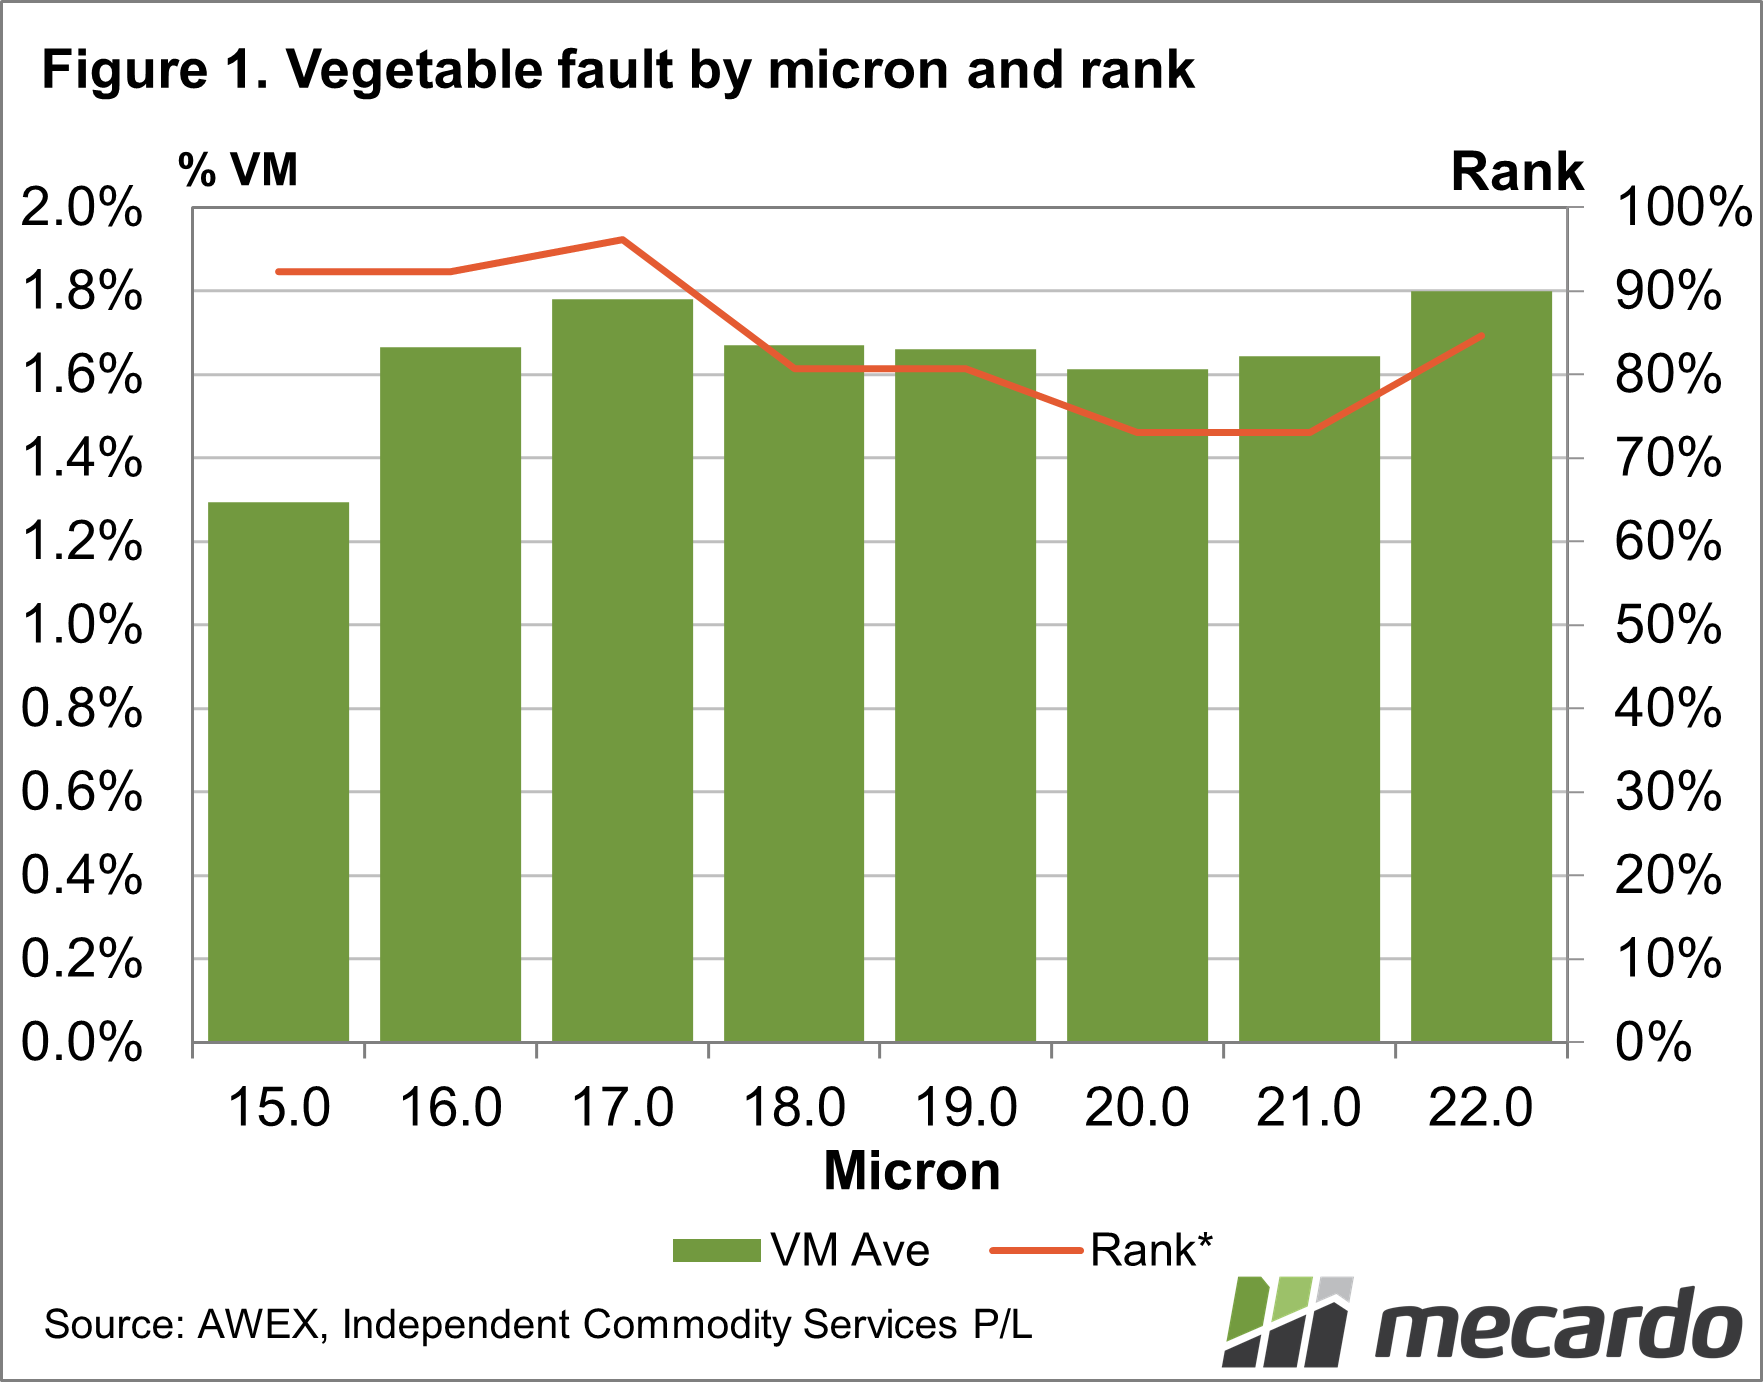
As mentioned in previous articles the supply chain works on the average specifications of wool production, through the season. It is a variation on the naïve forecast, which simply projects this year’s number into next year. In this case, the supply chain is using the average of recent years for forward planning. Figure 1 shows the average vegetable fault (VM) by micron category for combing Merino fleece from 15 to 22 micron for the current month to date (May). In addition it shows the percentile rank (line referring to the right hand scale) for this VM level for the month of May, using data from the mid-1990s onwards. The rank shows that VM levels are all relatively high, generally 80% or higher except for 20 and 21 micron. For 15 to 17 micron the VM rank is closer to 90%, so VM is a bigger issue for the finer Merino micron categories at present.
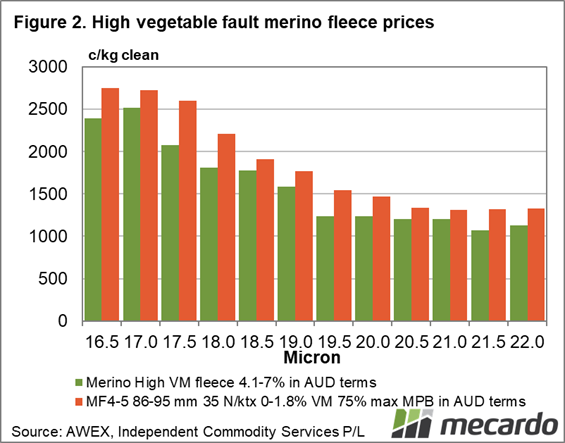
Figure 2 provides average weekly clean prices by half micron categories from last week from 16.5 to 22.0 micron for a base of 90 mm long Merino fleece with VM 1.8% or less and for Merino fleece with VM levels between 4.1% and 7%. In terms of developing a measure of VM discounts, it is a quick and dirty method, as there is plenty of room for variation in the comparison. Given this caveat we are interested in not so much valuing wool to the cent but looking at VM discounts in relation to past discounts.
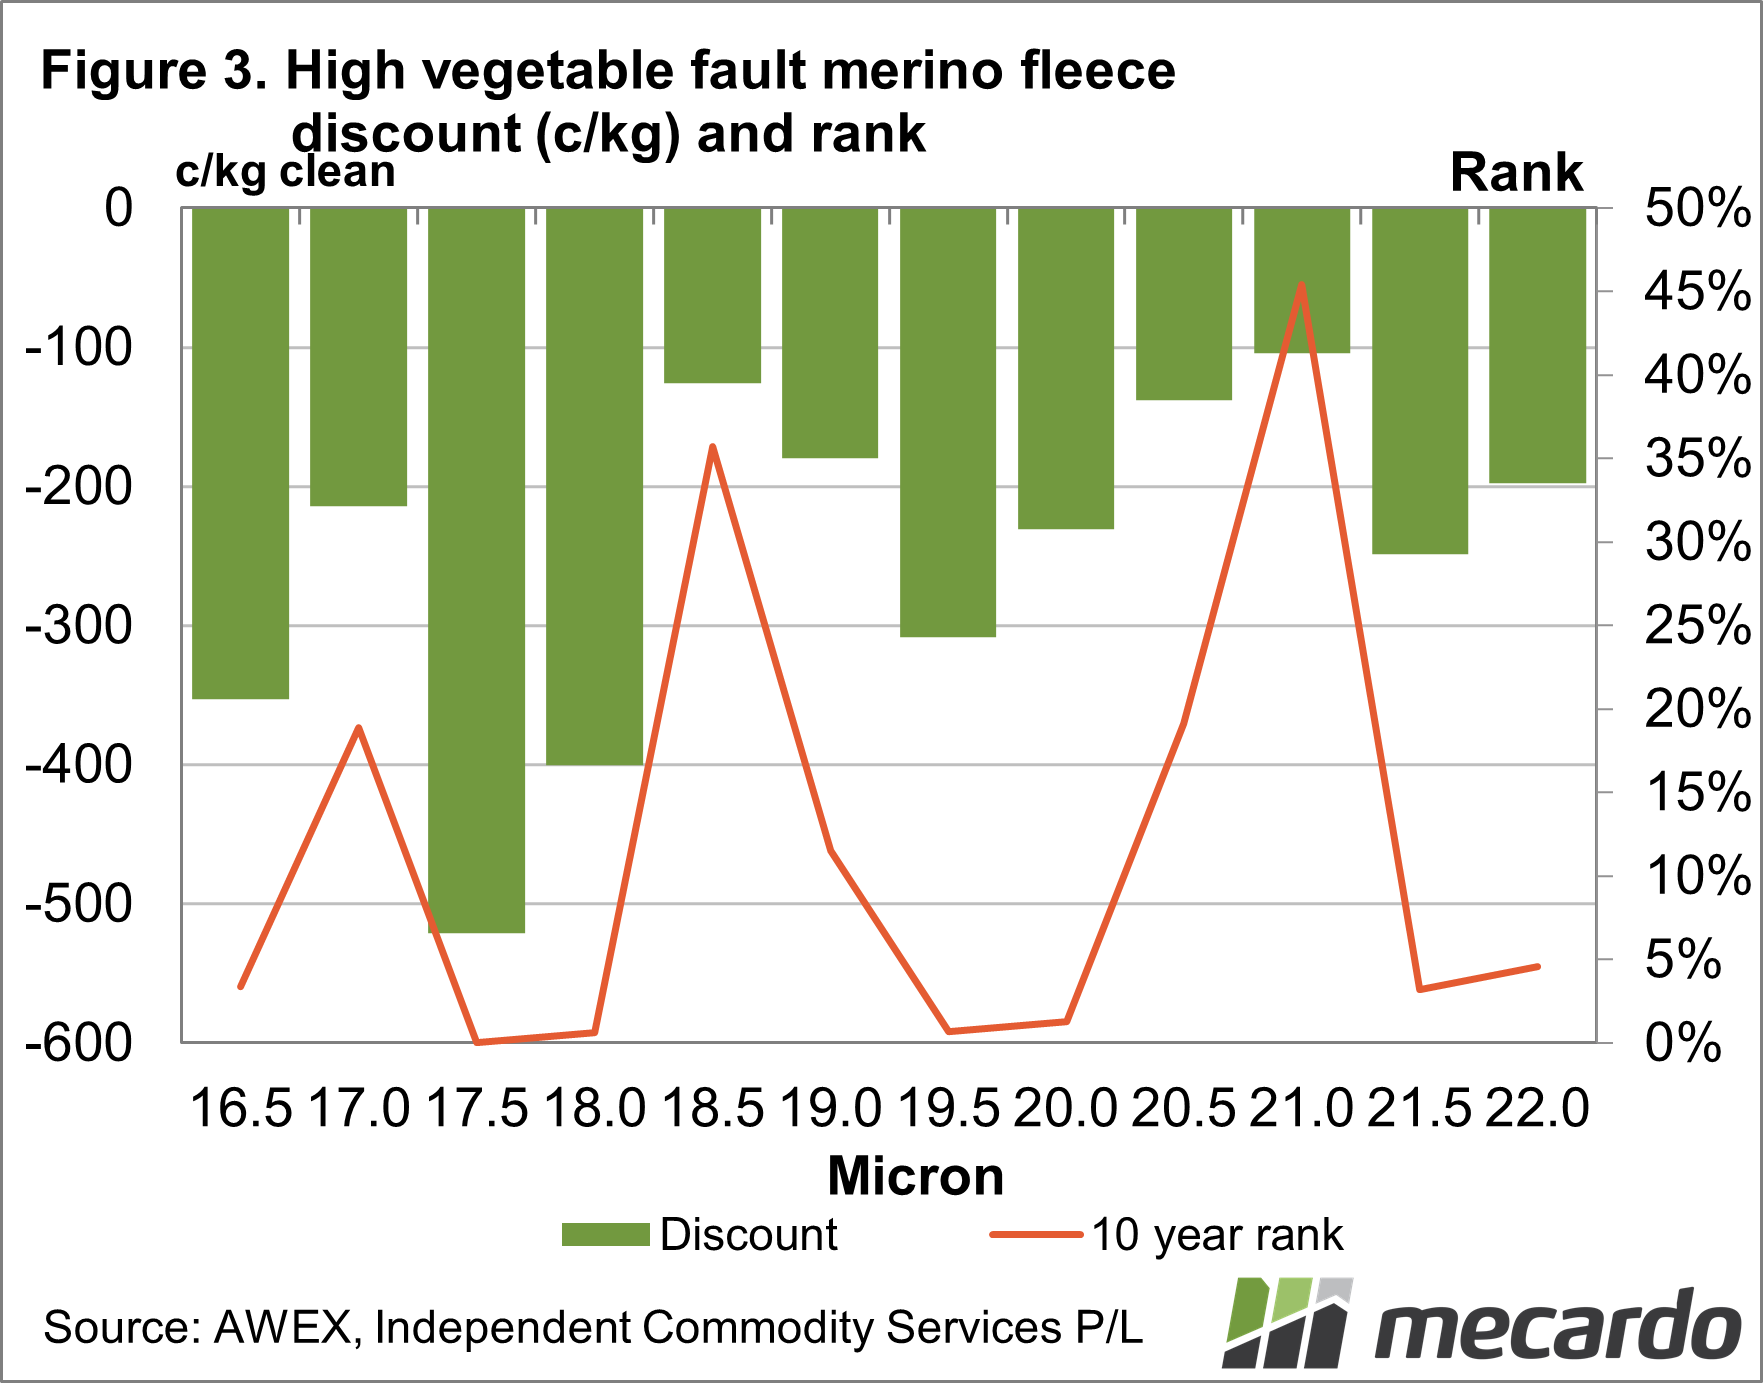
Figure 3 shows the difference between the two price series shown in Figure 1 in cents per clean kg terms (left hand scale) and the 10 year percentile rank of these discounts (line referring to the right hand scale). The percentile rank varies from near zero (nearly the largest discount in the past decade) to a rank of 35% to 45%. The median rank across all of the micron categories is in the lowest decile, so we can say that overall VM discounts are very wide by the standards of the past 10 years.
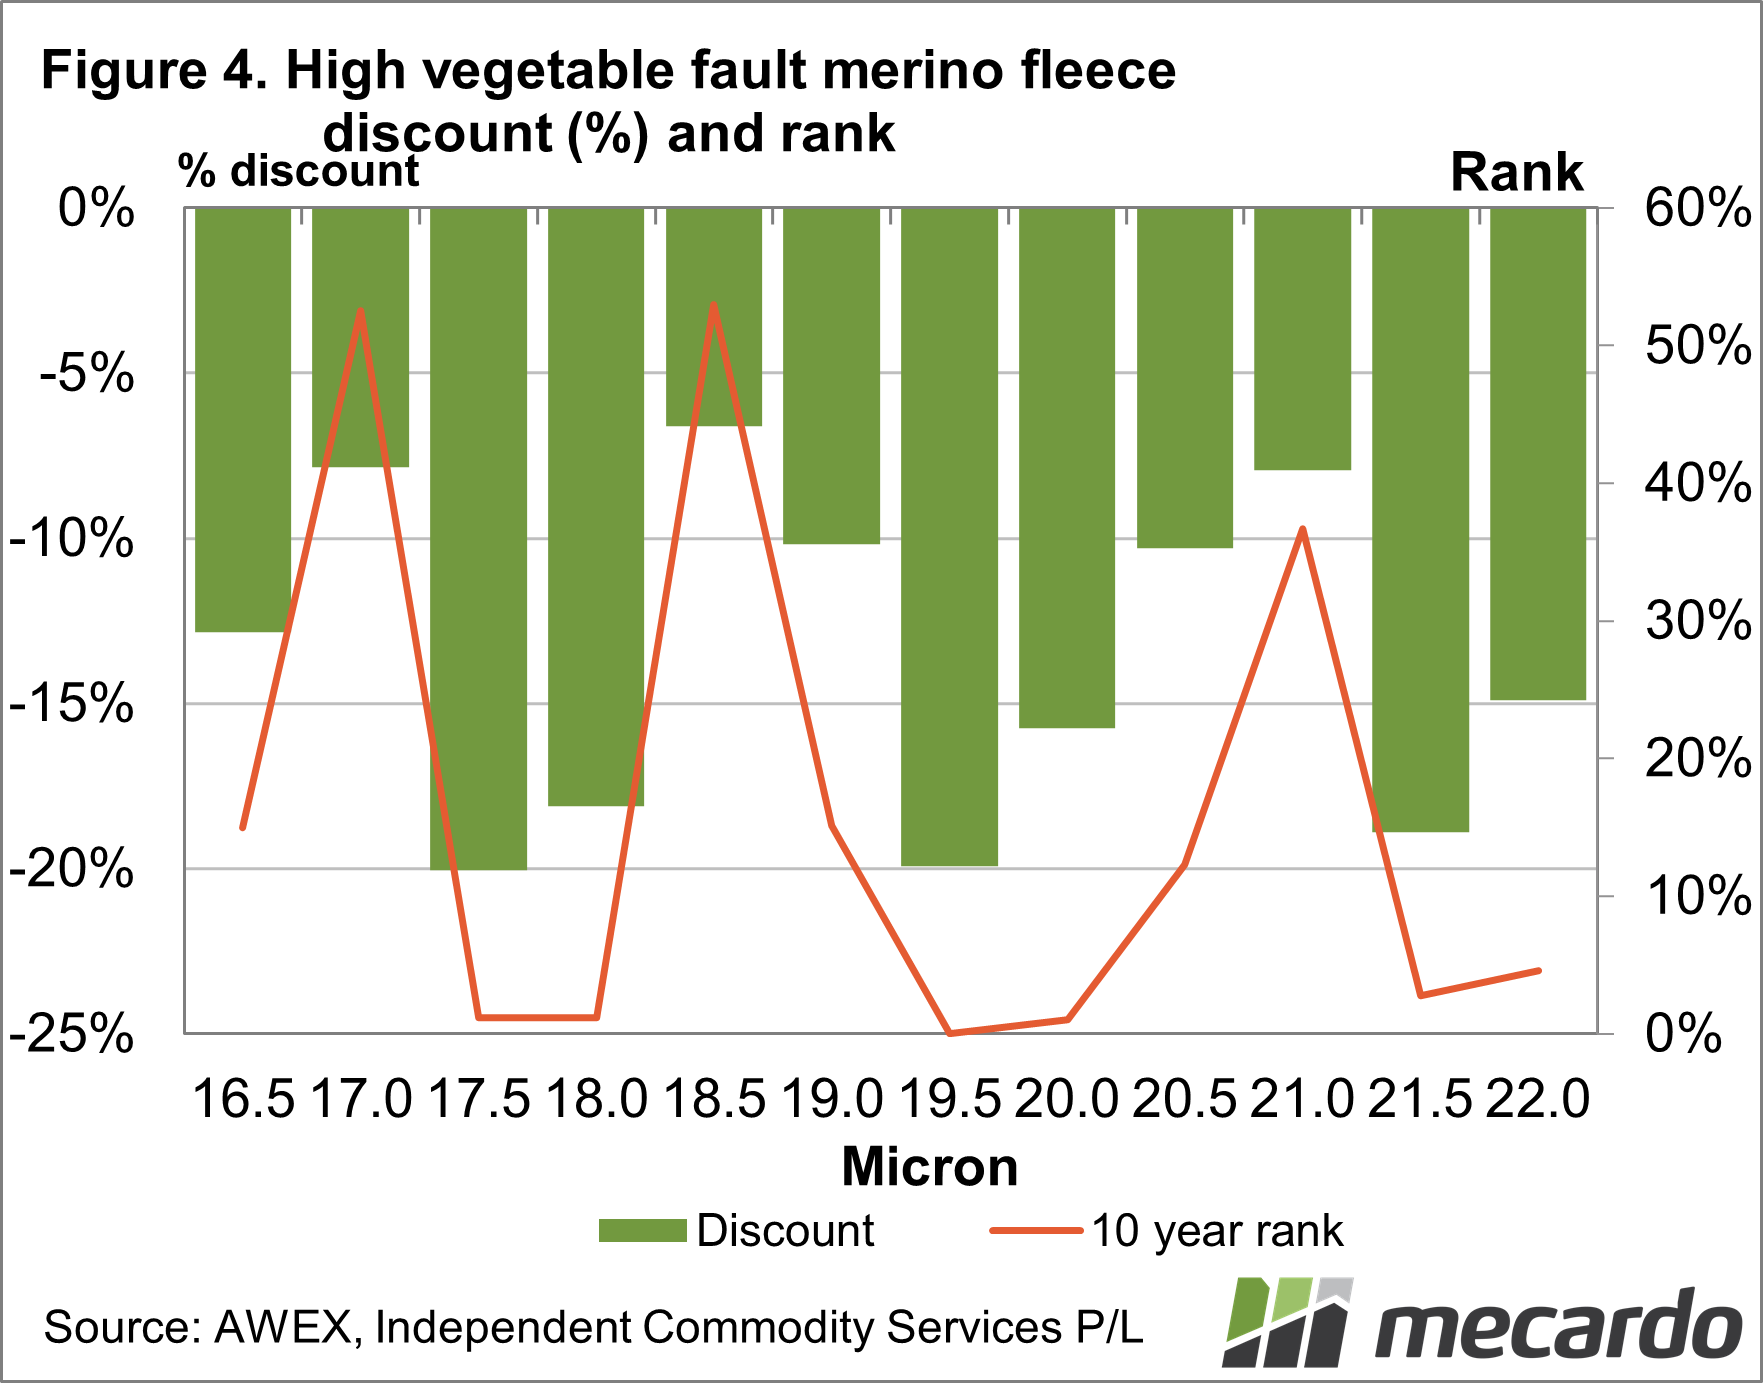
In Figure 4 the discounts shown are in percentage terms rather than cents per kg terms, with the 10 year percentile rank for the percentage discounts shown. The schematic provides a similar story to Figure 3, with some variation in the discounts and percentile rank and with the overall median rank of the discount in the lowest decile. VM discounts are very wide.
Mecardo looked at VM discounts last November (read here), thinking that the time to sell higher VM wool had arrived as the likelihood of VM discounts widening again in the autumn was high as the supply would be plentiful. This has proved to be the case, although discounts did not shrink as much as was expected in the November-January period.

What does it mean?
VM levels remain high by historic standards, across most micron categories although they have eased slightly for 20-21 micron May levels. As a consequence VM discounts remain high, and are likely to do so until the after the mid-season break in auctions in mid-2022.
Have any questions or comments?

Key Points
- VM discounts remain high by the standards of the past decade, across most Merino micron categories.
- VM levels, compared to the past quarter of a century, have increased most notably in the finer micron categories.
- It will be the new season (2022-2023) before we can expect the supply of VM to fall.
Click on figure to expand
Click on figure to expand
Click on figure to expand
Data sources: AWEX, ICS, Mecardo


