
Vegetable matter (VM) has been mentioned often in recent greasy wool market reports as an issue, especially for the broader merino categories. This article takes a look at the current season VM levels.
Mecardo has regularly covered VM levels in the Australian wool clip as it has in varies with seasonal conditions and can become an important factor which is discounted at auction. Last November the levels of VM were discussed and in December the regional sources of VM, which is important as VM tends to come from regions which produce broader merino wool.
The variation in VM levels impacts on price because processing machines are set to the average expected wool quality which has been produced in the recent past. Typically for a large proportion of consignments using merino fleece the required average VM is 1% with an upper limit on any one lot such as 1.8%. There are other orders which use higher VM levels, but they will be lower in number/volume, set to match the expected (average) volume of higher VM wool.
For the purpose of this article the monthly sales of combing merino fleece (greater than 60 mm in length) have been analysed the upper limit of VM which can be used while still achieving an overall 1% average. In drought affected wool this theoretical limit is high while in wool grown recent (good) seasons has a lower limit because there is relatively less low VM and more high VM wool. The analysis set 4% as a cap on the measured upper VM limit.
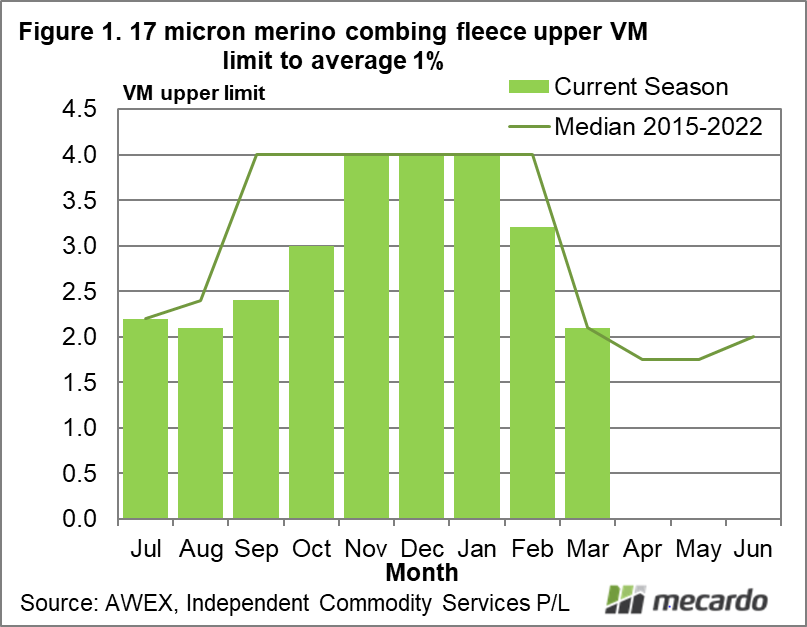
Figure 1 shows the median upper VM limit by month for the past six seasons for 17 micron combing merino fleece, and the upper limit by month for the current season to March. To clarify, in July the upper limit was 2.2%, close to the median of the past six seasons, which meant all of the merino combing wool 2.2% and lower could be used in a 1% average consignment. Move to October and while the long term median VM upper limit was 4% (meaning that exporters usually do not have significant limitations on building 17 micron consignments because of VM), 17 micron wool sold in October had more VM than normal and was causing some limitations. Overall though, apart from September and October, there has not been a significantly lower limit for VM in 17 micron fleece for the season.
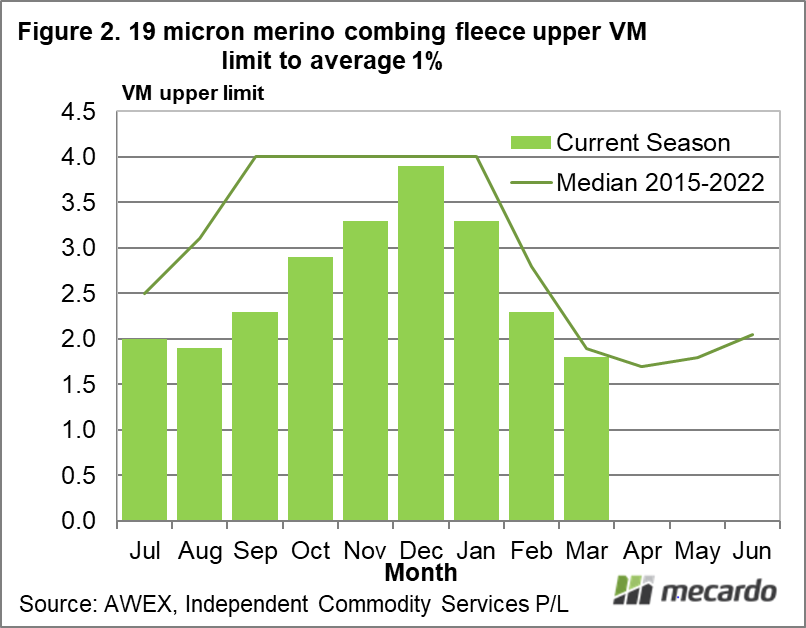
Figure 2 repeats the exercise for 19 micron. Here the story is different to 17 micron. Normally by September/October VM is not an issue. This season however exporters were struggling from July onwards. In July through September wool over 2-2.3% VM could not be squeezed into 1% average consignments. There will be exceptions such as for limited volume quality schemes but by and large VM levels were more limiting than normal last spring for 19 micron wool.
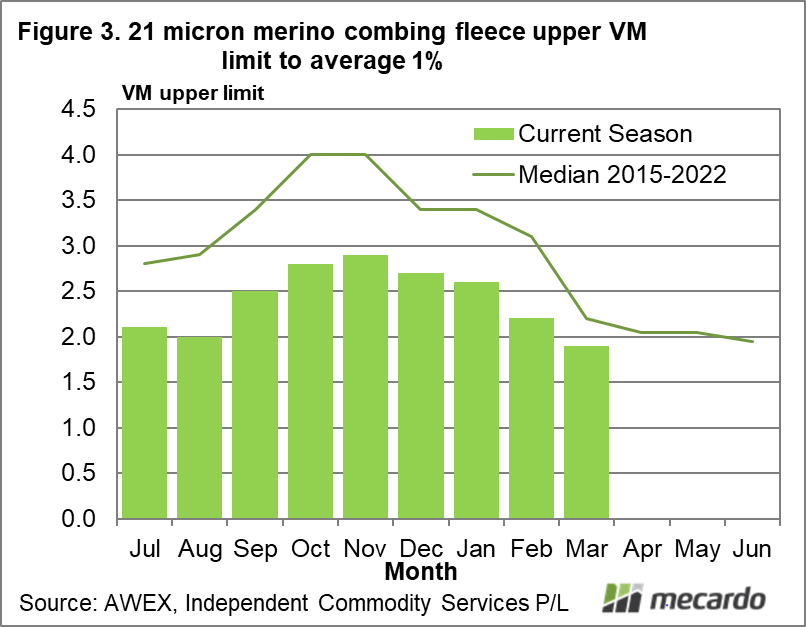
In Figure 3 the upper VM limit for 21 micron is shown. It shows why wool with 2% VM levels or more struggled in August when the discounts widened dramatically, and why they have done so again. Exporters are struggling to meet 1% VM consignment averages if they use wool with 2% or more VM. This helps to illustrate why discounts for the 2.5-3% VM broader merinos have been wide this season, and remain so.

What does it mean?
In a seaside analogy, fleece wool with VM levels in the 2% to 2.5% range are the tidal flats, sometimes with the tide in sometimes with the tide out. The relative scarcity of 0-1% VM wool this season, especially for the broader merino microns, has exporters struggling to meet consignment VM averages so demand has focussed on the low VM lots with a reduction in demand for the 2% plus VM lots which means wider discounts.
Have any questions or comments?

Key Points
- The supply chain generally assumes quality in wool clips will be around its longer term average, so when quality varies from the average relative prices (premiums and discounts) vary accordingly.
- This season VM has been generally higher than normal, especially for merino wool on the broader side of 19 micron.
- In practical terms this means the value of low VM wool has lifted relative to higher VM wool.
- It also means wool which falls outside of the cut-off levels for fitting into a 1% VM average consignment have suffered the most.
Click on figure to expand
Click on figure to expand
Click on figure to expand
Data sources: AWEX, ICS, Mecardo


