Vegetable matter (VM) levels are up this year as was expected from the much improved seasonal conditions in 2020, which has caused problems for exporters in meeting consignment averages which are typically around 1% for many orders. This article takes a look at VM supply.
Mecardo last looked at changes in VM levels and at the relation between VM supply and discounts in January. Mecardo looked at the relationship between rainfall and VM, so the increased rainfall in 2020 following such dry years was bound to lead to increased levels of vegetable matter.
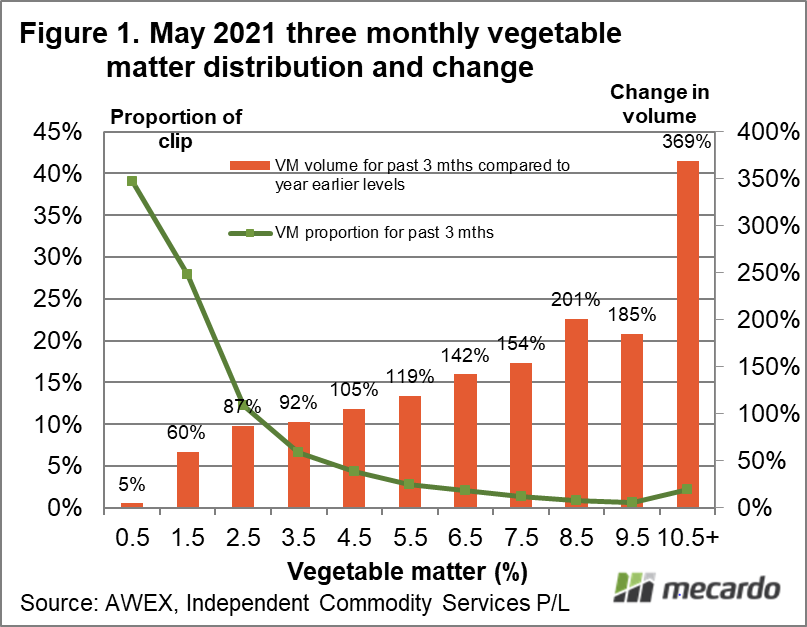
Figure 1 updates the analysis shown last January, looking at the change in volume of wool sold at auction for a range of VM levels (along the horizontal axis) for the three months to May, compared to year earlier levels. The change is slightly understated as there is one week of auction sales for May 2021 to be added to the data. The change is shown with the bars (right hand vertical axis) while the line (left hand vertical axis) shows the proportion of wool for each VM level. Note that the change in volume rises as VM levels increase. Increased total clip volumes means the volume for the low VM levels has still increased – in a period when the total volume does not change there would be less very low VM wool.
Increased supplies of higher VM wool relative to low VM wool means the value of low VM wool has increased for exporters trying to meet 1% VM averages in consignments, and the value of higher VM wool has fallen relative to the low VM wool.
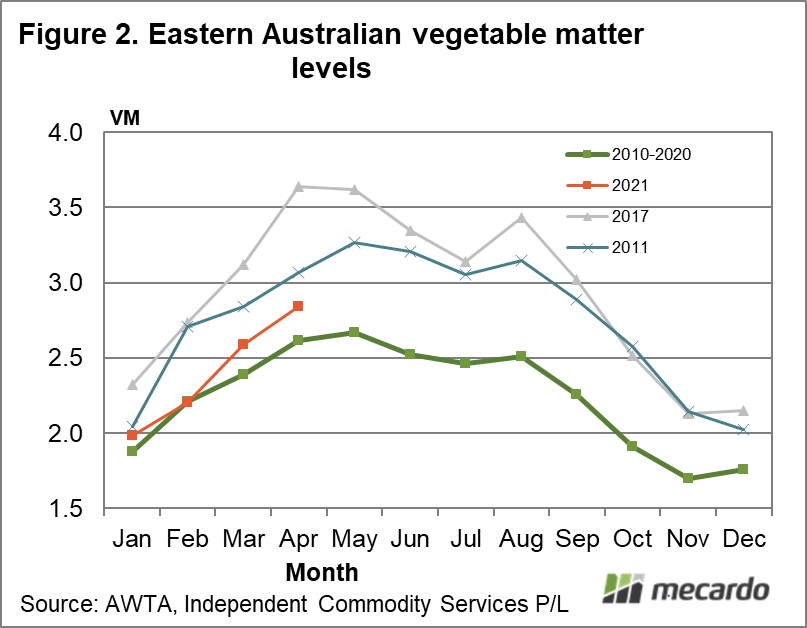
Where to from here? Figure 2 shows the monthly average VM levels for eastern Australia for the 2010-2020 period, for the calendar year to date and for a couple of high VM years (2011 and 2017). AWTA data is used for this graphic. VM levels in 2021 are running above the decade average, but still below 2011 and 2017. The seasonal pattern shows that VM levels will not start to trend lower until the spring, in September. Until then VM levels will remain relatively high, above the seasonal average.
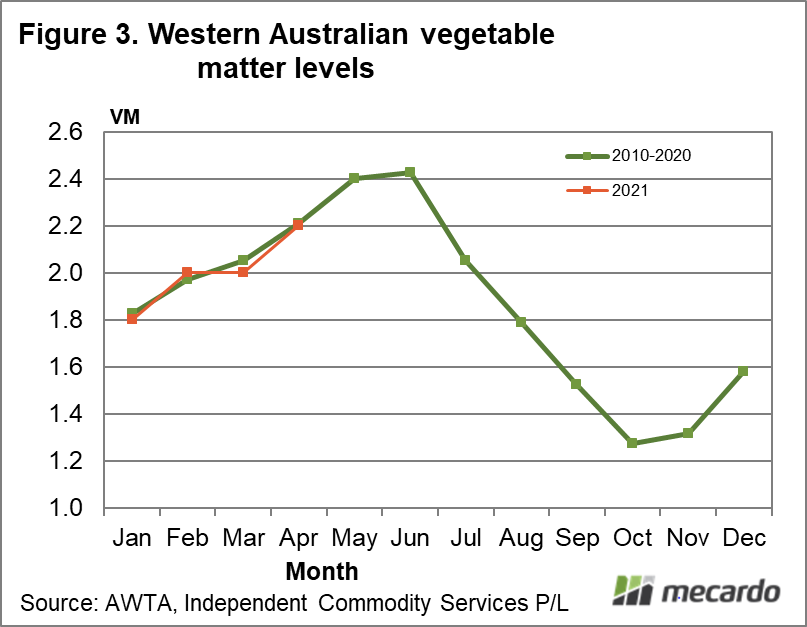
Figure 3 repeats the monthly VM analysis for Western Australia. In the west the seasonal pattern is a little different, peaking in the middle of the calendar year and then declining through to October/November. Seasonal conditions in 2020 were less favourable in the west, so VM levels for 2021 are running along decade average levels.

What does it mean?
While VM levels normally increase from early in the calendar year through to the middle of the calendar year and then fall until the end of the calendar year – over the top of the seasonal pattern, the nature of seasonal conditions can push the VM level higher of lower. In eastern Australia the good seasonal conditions in 2020 have pushed VM levels higher than average, with premiums and discounts responding accordingly. VM is less of an issue in Western Australia, as VM levels are running at average levels.
Have any questions or comments?
Key Points
- Higher VM levels continue to increase year on year, in eastern Australia.
- VM levels in Western Australia are running along decade average levels.
- The seasonal patterns for VM shows that levels will remain high in eastern Australia until early in the spring.
Click on figure to expand
Click on figure to expand
Click on figure to expand
Data sources: AWEX, ICS , Mecardo
