Recent good rainfall and favourable conditions in many areas of Australia have caused grain crop forecasts to be upgraded significantly, contributing to domestic price declines. Weather reports cover the whole country, though, not just the 3% of our land mass that is planted to crops, so how can we easily compare how our rainfall situation is tracking with other years?
The USDA has upgraded their forecast for the Australian 2022/23 wheat crop by 2mmt (7%) to 33mmt. This represents an increase of 9% above the initial ABARES forecast of 30.3mmt put out in early June 2022.
Some other analysts are not so sure that our wheat production will come in so high though. The latest crop modelling based on rainfall and temperature data conducted by Riverina’s commodity trading manager, John Mulally, comes in 1.3mmt, or 4% lower at 31.7mmt. Similar to other analysts, he has bumped up his estimates in the last month on the back of more positive conditions and expects that there could be more upside to production coming as the season continues. But when it comes to rain, there can also be too much of a good thing, and some areas of the cropping belt may have suffered the consequences.
Parts of the central west of NSW, which covers around 700kha and ~1.6Mmt, has been challenged by saturated soils, and flood events creating potential for substantial crop losses. Only time, and proof by way of grain in bins come harvest season this summer will provide certainty about whether yield downgrade predictions of up to 50% in the worst affected areas will come to fruition or not.
So, it rained, but Australia is a big country, with our area under crops representing only around 3% of our total land mass. How do we reliably compare and contrast exactly how good this season has been relative to prior years?
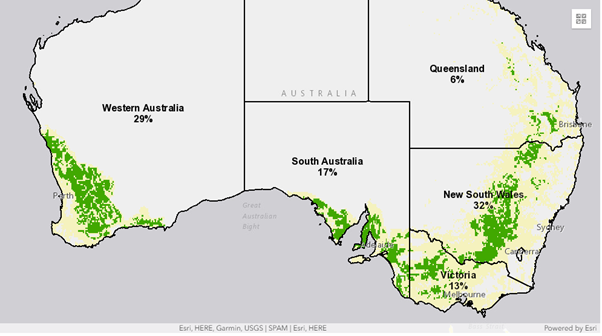
When considering rainfall for Australia in the context of overall crop prospects, only the rain that actually falls on croplands is of relevance, so national, or state-based averages can be misleading because they include areas like cities, bushland, and livestock farms. Figure 1 depicts where wheat is grown in Australia on a map. For example, the planted area of ~3.6m Ha of wheat in NSW represents barely 4.4% of the total area of NSW.
The way to solve this problem, is for the data to be filtered by what is called a “mask”, similar to a stencil, or blinkers on a horse, it allows us to focus only on what matters.
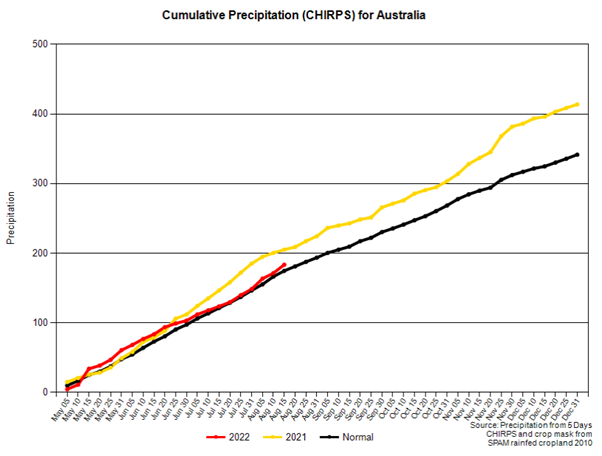
Looking at the latest USDA Australian “masked” rainfall data for August, (figure 2) we can see that as a whole, at an average of 190mm, estimates of cumulative precipitation since May that has fallen on the Australian wheat crop is actually only slightly better than a typical year, and is currently tracking at ~7% below 2021 conditions. Looking to the states (not shown) cumulative rainfall is currently below average in WA & VIC, with well above average figures in NSW and QLD holding the national average figure higher.
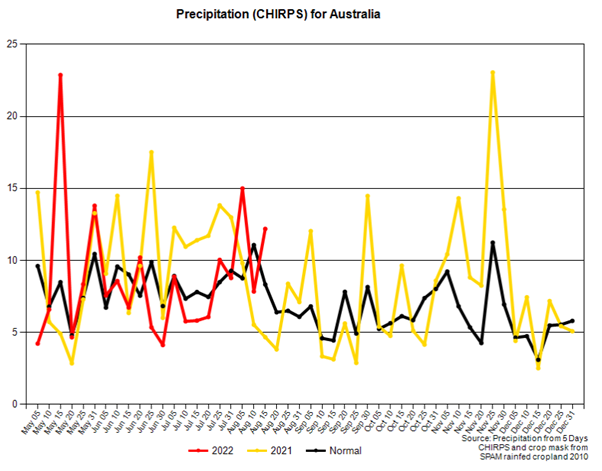
In Figure 3, we switch to a weekly rainfall view, which clearly shows that our crops have experienced rainfall that is roughly between 20% and 50% above average in the past few weeks, also outperforming 2021. NSW average soil moisture levels are sitting at 74%, and the weekly chart in (figure 4) confirms that NSW paddocks received a deluge of rain up to 120% higher than average in recent weeks which is the source of concern for potential yield downgrades for some producers.
The Aussie 2022/23 winter crop is barely at half time at this point in the season though- while wheat is playing a strong game currently, the coming months will be more critical, and a lot can happen between now and harvest time, so big swings in forecasts can, and probably will happen. Snarls in logistics are still a continual worry. The 4% drop in Geelong APW1 pricing we have seen in recent days hasn’t just been down to falls on CBOT and the upgraded aussies crop forecast, issues with shipping stem allocations at Viterra were also a substantial contributor.

What does it mean?
Improvements in seasonal growing conditions over recent weeks have boosted expectations for a solid Australian wheat crop and contributed to pressure on domestic wheat prices. The rainfall data suggests that the season may only be tracking at a slightly better rate than average so far however, and at any rate, favourable rainfall rates will need to be maintained over the critical spring period to maintain expectations of another solid crop.
Have any questions or comments?
Key Points
- USDA upgraded Aussie wheat forecast to 33mmt
- Rainfall data focused and filtered by a crop area “mask” provides real insight into how good recent conditions have actually been.
- It isn’t over till it’s the grain is in the bin, expect forecast volatility over the next few months, and pricing with it.
Click on figure to expand
Source: USDA
Source: USDA
Data sources: USDA, Mecardo, Riverina
