
Last week Mecardo looked at what the effect of not changing volume or not changing fibre diameter during the past three decades would have had on merino production, by specific micron categories. This week Mecardo takes these hypotheticals for the 21 micron category and looks at modelled prices given the two scenarios.
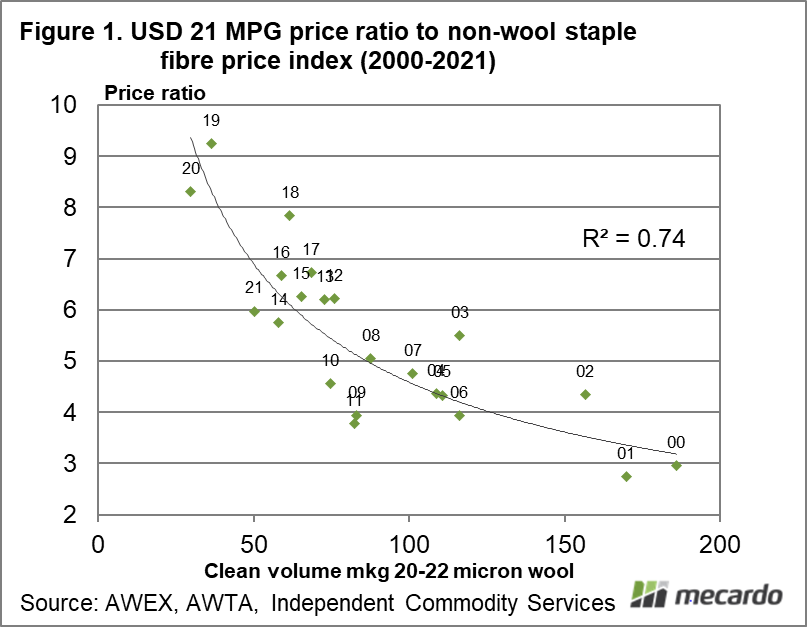
As the supply of merino wool has fallen in recent decades (see last weeks article), the price ratios for merino wool to the big industrial apparel fibres have tended to increase. This is not the case for very fine merino wool, because supply has increased greatly hence putting downward pressure on price. Figure 1 compares the volume of Australian 20-22 micron wool to the price ratio of the 21 MPG to a composite apparel fibre price made up of cotton, polyester staple, acrylic staple and viscose (non-wool staple fibres). The graph begins with data in 2000, at the end of the 1990s when the stock overhang from the RPS weighed merino prices down. While there is a nice trend in the data, there is some considerable variation around the trend (such as in 2011 – cotton boom, 2009 – GFC, 2003 and 2002 – classic wool rising price cycle after liquidation of a large stockpile) which is a reminder that other factors can influence this ratio.
For the purposes of this article the trend in Figure 1 (with the outlier years removed) has been taken as the base for modelling the 21 MPG according to the volume of 20-22 micron wool available, which varies with the different scenarios presented in the last week’s article.
In Figure 2 the actual annual average 21 MPG in USD terms is shown from the 1999-00 season through to 2020-21. The second price series is the 21 MPG calculated using the scenario where the merino micron was unchanged from the early 1990s with the overall volume shrinking as it did. The volume of 20-22 micron wool is calculated for each year, with the theoretical price ratio to the composite apparel fibre price generated and then applied to the composite apparel fibre price for that year. In essence Figure 1 shows the likely 21 micron price (in US dollar terms) if the Australian merino clip still averaged 21 micron – there would be more 20-22 micron wool and presumably the price ratio would be lower hence the value of the 21 MPG would be lower.
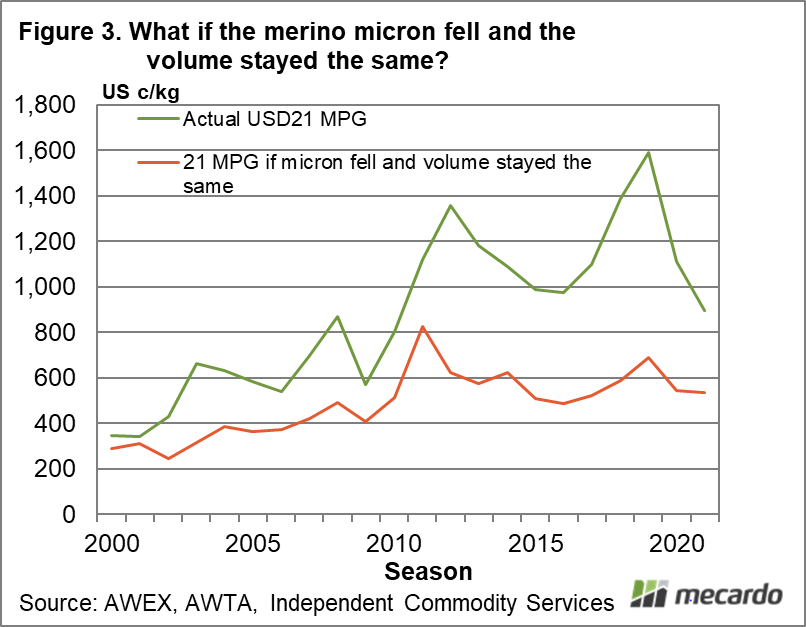
Figure 3 repeats the exercise with the scenario where the overall volume of the merino clip (about three times todays clip) was held constant with the average merino fibre diameter falling to where it now averages 19 micron. The volume of 20-22 micron wool would be much higher with the modelled price ratio in the range of 3 to 4, delivering a much lower price.
The strong correlation between supply and the price ratios shown in this article is a good argument that lower supply has been a big driver, albeit not all, of the increase in merino prices in recent decades. The composite apparel fibre used in this article has averaged around US160 cents during the past five seasons. If the 21 micron category was still operating at a 3:1 price ratio, that would deliver a price of just US580 cents. Lamb anyone?

What does it mean?
While this article is part whimsy, the study of price ratios is useful as one measure of how merino wool is tracking. It is a good way of looking at how wool is embedded in the greater apparel fibre complex. The scenarios show that if the industry had not reduced fibre diameter it is highly likely it would be even further reduced than it is now, due to lower prices.
Have any questions or comments?

Key Points
- The combination of lower and finer merino production has reduced 20-22 micron production, which has underpinned relative increases in prices for these categories.
- Any discussion of price in the bigger picture needs to take account of changes in supply, both cyclical and structural.
- The 21 MPG prices shown in the modelled scenarios would be unviable for the wool industry.
Click on figure to expand

Click on figure to expand
Click on figure to expand
Data sources: AWEX, AWTA, ICS, Mecardo


