For Australia, La Niña weather conditions mean higher and more consistent rainfall, and better yields for crops as a result. Conventional wisdom is that the impact is thought to be not quite so rosy for producers in other parts of the world like South America, Russia and the former Soviet Union, but how true is that general understanding?
A La Niña weather event in Australia provides a great deal of confidence and optimism for producers in Australia, but on the other side of the coin, it can sound the gong of pessimism for production on the other side of the world – that which we compete with in the global export markets.
The general understanding of the impact of La Niña is that while Australia enjoys wetter conditions that can improve cropping prospects, the southern USA, South America and parts of Russia and the former Soviet Union such as Ukraine and Kazakhstan are generally thought to suffer dryer conditions detrimental to the development and yield of their crops.
Analysis by the world bank (2018) concluded that La Niña events have been generally detrimental to wheat crop yields in the RUK (Russia – Ukraine – Kazakhstan) region.
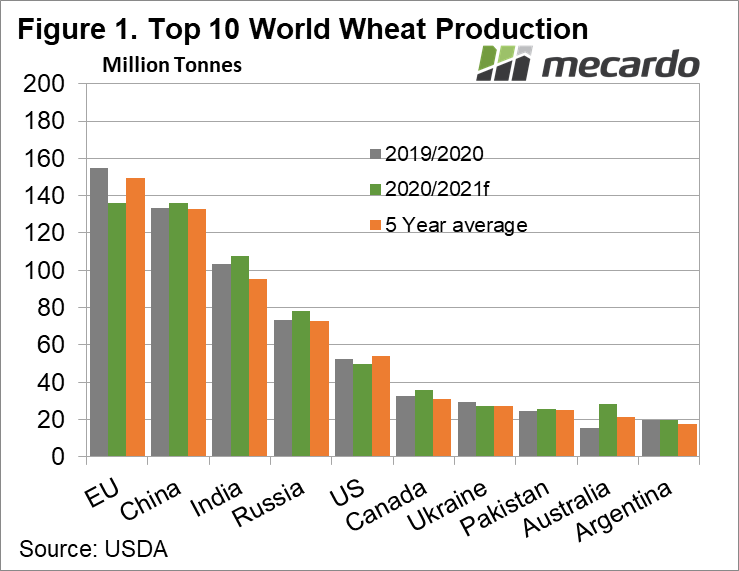
Argentina, Russia and Ukraine lie in the top 10 wheat producing regions in the world, and are significant competitors to Australia in global wheat export markets.
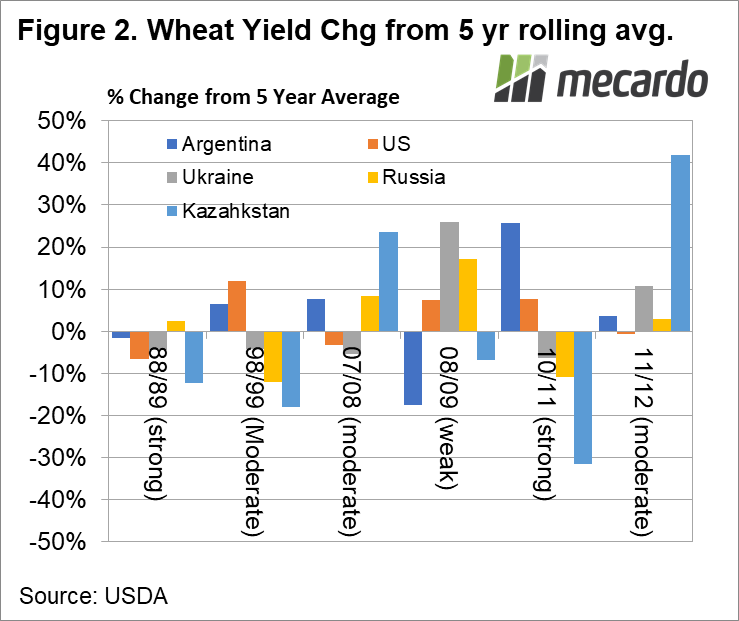
In Figure 2, we consider the percentage change in wheat yield from a rolling 5-year average for the RUK region, plus Argentina and the US for La Niña years.
The results are not overly conclusive, with a lot of variability obvious, and in many years, we see that yields can be better than the 5-year average. However, one insight that can be picked out is that only La Niña events that are considered strong have an overly obvious negative relationship to wheat yields in the Baltic regions. Perversely, Argentina and the US appear to generally record better than average yields in La Niña Years, which is against the conventional wisdom. The small sample size of these observations means we have to take any conclusions from this data with a grain of salt though.
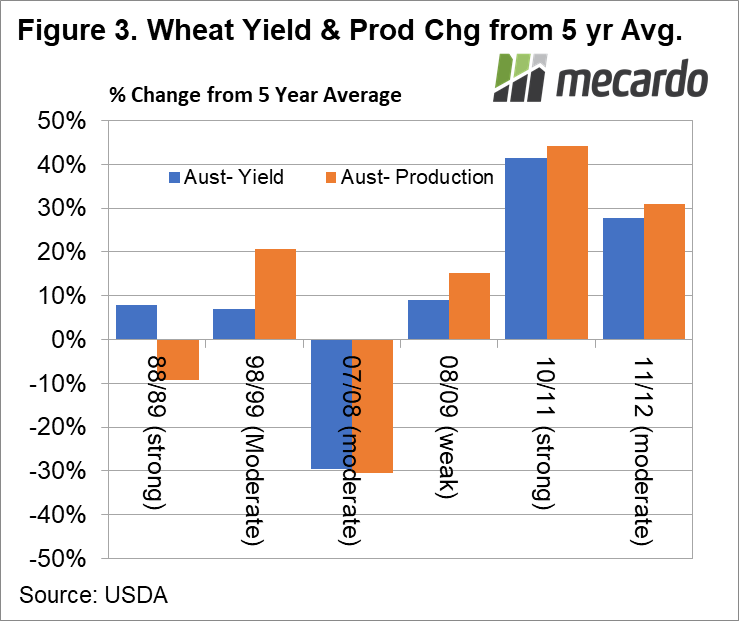
In contrast, Figure 3 illustrates the change from the rolling 5-year average for Australian wheat yield and production, and a positive relationship is more consistently apparent, with four out of six la Niña years resulting in improved yields and production.
An explanation for the lack of a consistent relationship, is that the timing, strength and duration of each La Niña event is unique, which in turn affects the timing and distribution of the pattern of rainfall (or lack there of) in each year, and its match to the cycle of crop development in each region.

What does it mean?
While Australia benefits from La Niña, other major competing global grain exporters only typically experience sufficiently undesirable conditions that flow through to poorer yielding crops when the La Niña event is considered strong. In other la Niña years, many of these producing regions actually report improved yields, so it cannot be said with a great degree of confidence that a La Niña event will result in reduced wheat yields and production in South America, the US, and the RUK region.
Have any questions or comments?
Key Points
- La Niña events are unique and have inconsistent effects
- Strong La Niña events appear to have more negative impacts on Baltic regions
- Against conventional wisdom, Argentina generally seems positively impacted by La Niña
Click on figure to expand
Click on figure to expand
Click on figure to expand
Data sources: USDA, BOM, Mecardo