Wool quality schemes operate in the main wool exporting nations, beyond the bounds of Australian production. This article, courtesy of some excellent data presented by the IWTO, takes a wider look at the supply of the main (selected) quality schemes from southern hemisphere wool exporting countries.
Premiums for RWS accredited wool (see recent articles on from May & March), have attracted a lot of attention this year and rightly so as they are large premiums, operating in Australia and South Africa, for merino and crossbred wool. With the regular publication of South African premiums and volumes by Cape Wools we have a good idea of price and volume in two of the main southern hemisphere wool export markets (South Africa and Australia). Naturally we would like to know what is happening in New Zealand which has a small, fine merino clip (averaging 17 micron) and South America where the greasy wool supply is non-mulesed. The International Wool textile Organisation (IWTO) has collected and published the volume data for selected quality schemes.
With the withdrawal of the Australian wool marketing organisation from publishing regular big picture analysis the IWTO has beefed up its efforts in this area. The flagship publication for the IWTO is their annual Market Information booklet which this year has provided overall total volumes for the main wool quality schemes and a country-by-country breakdown for all bar ZQ.
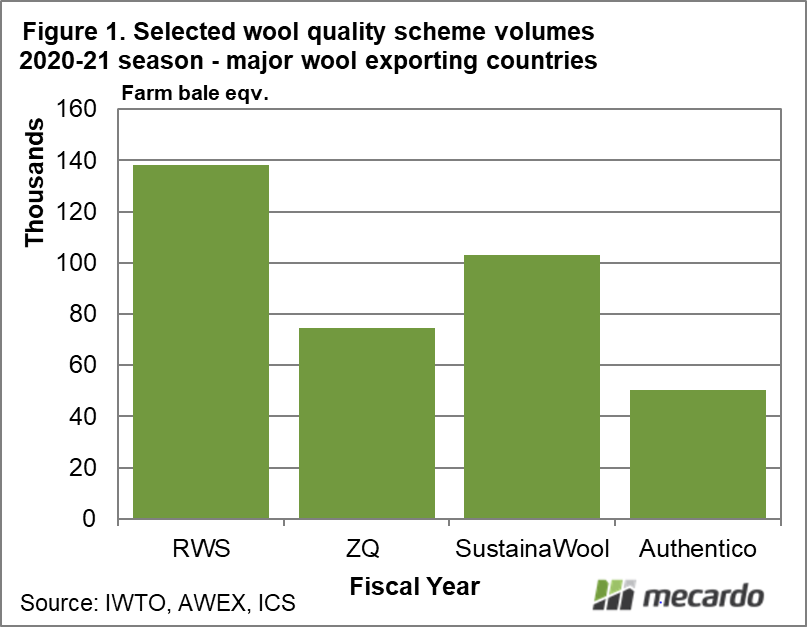
Figure 1shows the total volume of four selected wool quality schemes, in farm bale equivalents, for the 2020-21 season. RWS comes in as the largest at nearly 140,000 farm bales with SustainaWool second with around 100,000 farm bales. These numbers will be underestimating the current supply which has lifted this season in both Australia and South Africa, which is as far as we know.
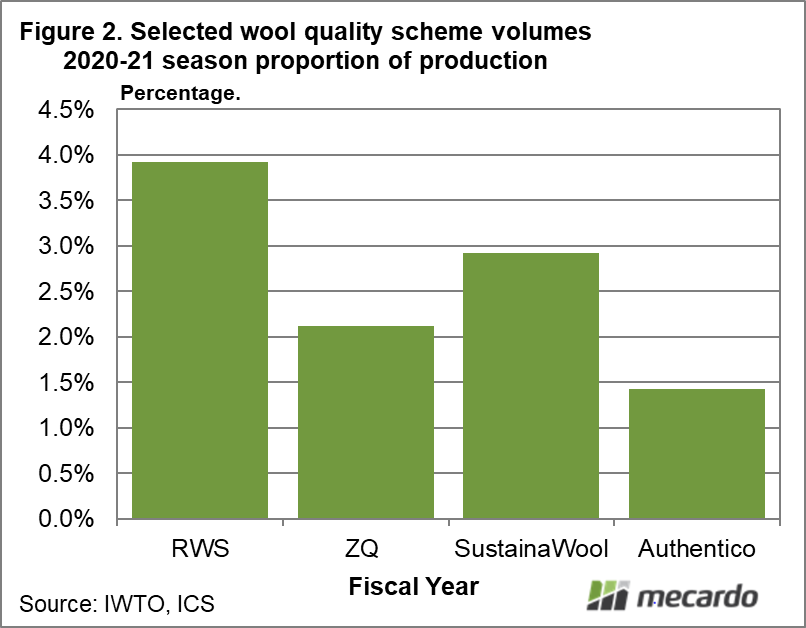
In Figure 2 the volumes from Figure 1 are put in the perspective of total production from the main southern hemisphere wool exporters and the USA, all breeds and all sorts of wool included. From this perspective 4% of wool production was accredited to RWS, nearly 3% to SustainaWool, 2% to ZQ and 1.5% to Authentico, keeping in mind that wool (in Australia in particular) is often accredited to more than one quality scheme.
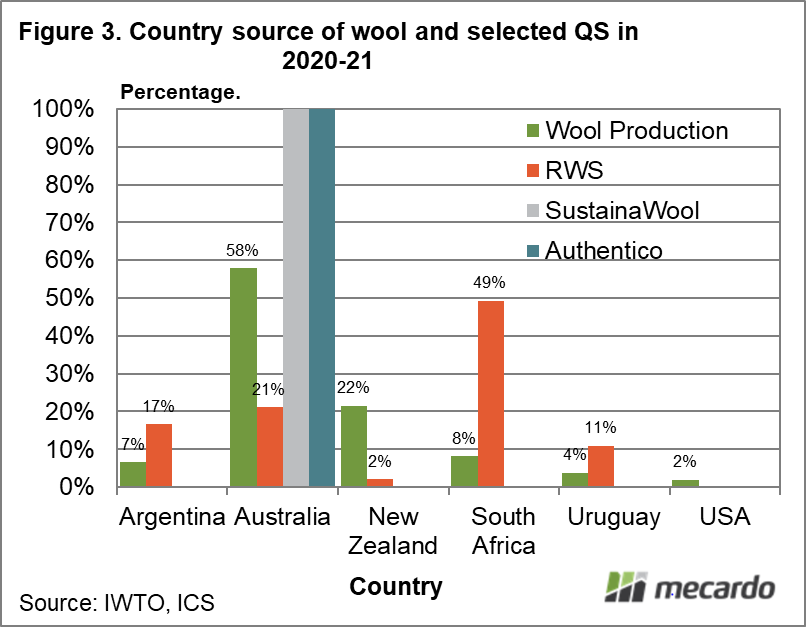
Quality system volumes are broken up by country in Figure 3 (note that ZQ is not shown as no country breakup was provided in the IWTO publication). The proportion of production is given for each country. For example Australia accounts for 58% of greasy production in this collection of countries and Argentina 7%. For each quality scheme the proportion derived from each country is given. All of SustainaWool and Authentico were sourced from Australia in 2020-21. For RWS 49% came from South Africa, 17% from Argentina, 21% from Australia, 2% from New Zealand and 11% from Uruguay. In terms of their proportions of production Argentina, Uruguay and South Africa outperformed in the supply of RWS wool.
What does it mean?
In terms of delivering what the supply chain wants with regards to RWS wool, Australia is lagging behind the other southern hemisphere wool producers by a long way. Overall the proportion of greasy wool accredited to quality schemes remains small, but it is growing. The Australian wool industry often says it produces the best wool in the world, which is an arguable proposition. The world continues to change and the Australian industry needs to change in order to keep up.
Have any questions or comments?
Key Points
- Half of total RWS wool came from South Africa in the 2020-21 season, with Australia providing 21% of RWS supply (versus 58% of total wool production from the southern hemisphere exporters).
- SustainaWool and Authentico were focussed on Australian wool.
Click on figure to expand
Click on figure to expand
Click on figure to expand
Data sources:
IWTO, AWEX, ICS


