Week to week variations in the volume of wool offered for sale in Australia gets some blame in press reports for the price volatility seen recently. Volume is a sensitive subject in a time of constrained demand. This article takes a look at volume and then its relationship to price in recent months.
The supply of wool at auction markets is both lumpy and seasonal. It is lumpy in that volume is pushed up and down by growers holding wool back or pushing wool into the market in response to changes in price. The other cause of ‘lumpy’ volumes are the recesses in sales (at Christmas, in the middle of the calendar year and for Easter) when wool banks up in brokers stores, to be offered following the recess. Seasonal variation in production hence supply is more consistent, although this has smoothed out in recent decades.
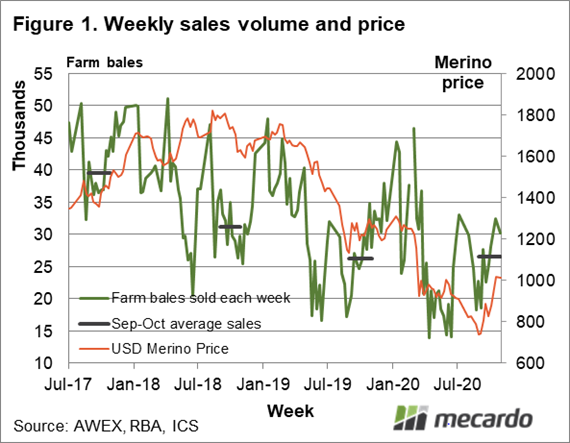
Figure 1 shows how these factors combine to cause volatility in supply. In Figure 1 the weekly volume of farm bales sold at auction from mid-2017 to October 2020 (left hand scale) is shown, along with the average volume for the September-October period in each year. The weekly average price for merino wool in US dollar terms is also shown which uses the right-hand scale. In 2020 the weekly volume of wool sold has ranged from 46,000 bales (in March) to 14,000 bales (April through June).
The effect of COVID-19 showed up in wool prices in March 2020, when prices fell by 26% in the space of three weeks. At the same time the volume of wool sold fell from around 34,000 bales per week in January/February to around 20,000 bales per week in April through June, a fall of 43%. Year on year the April to June 2020 sale volumes were down 26% on comparable 2019 levels. Markedly lower prices on markedly lower volumes at the time looked very worrying. From July onwards sales volumes partially recovered, so that in September/October the average weekly sales in farm bales (26,500 bales) were on par with year earlier levels. In the same period in 2018 sales were 31,200 bales per week but production has fallen by 12% since then so the 2020 September/October clearance is not that much lower than in 2018 when adjusted for the drop in supply.
Another interesting point from Figure 1(in hindsight) is the divergence of price and volume in the spring of 2018. From the autumn of 2018 the merino price continued to firm while the volume of sales eased. Sales of merino wool year on year started trending lower in mid-2017 through to late 2018. In hindsight the lower volume was helping to support prices from mid-2018 onwards, as prices for other apparel fibres started to ease (view previous fibres article here).
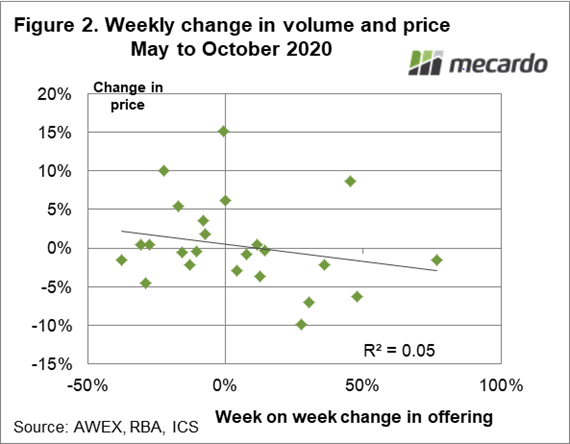
Finally, what relationship do week to week changes in sales offerings (total volume offered for sale) have with week to week changes in price? Figure 2 compares the week to week changes in offer volumes and the merino price in US dollar terms. In short there is no relationship.

What does it mean?
Reports which pin week to week wool price movements to changes in the volume of wool offered should be treated with scepticism. When demand suffers a contraction (as it did in mid-2019 and again this autumn due to COVID-19) the volume of wool sold falls sharply, steadying and recovering as confidence returns to the market which trades at a new, lower price level. This appears to happening again as it did in 2019.
Have any questions or comments?
Key Points
- Weekly sales volumes have picked up since the April to June 2020 period.
- Sales volumes in September/October in 2020 were on par with the same period in 2019.
- Since May there has been no discernible relationship between week changes in offer volumes and the average merino price.
Click on graph to expand
Click on graph to expand
Data sources: AWEX, RBA, ICS, Mecardo.