
While demand, or a lack of demand, is driving the wool market lower, supply remains of interest. The gap between supply and demand has seen farmer stocks build, with this trend likely to continue at least for the first half of this season. This analysis takes a look at supply and its relationship to demand in a COVID-19 driven market.
The latest AWTA core test volumes were down by 15% for July and for the three months to July. AWTA data is available on the excellent AWTA website HERE. Bale weight was up slightly and yield was steady so the fall in clean volumes was slightly smaller than 15%.
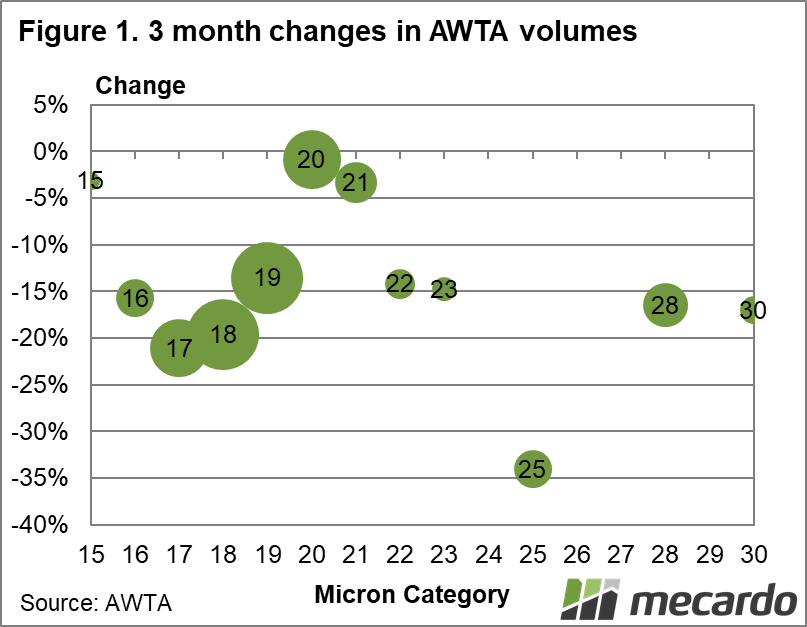
Figure 1 shows the change in volumes for the past three months by micron category, with the size of the bubbles reflecting the proportion of wool accounted for by the micron category. This helps put some of the changes in volume in context. A big change in volume by a small category (the 25 micron category for example) might have implications for the 25 micron price but little for the overall market. The 20 and 21 micron categories had the smallest fall in supply, with the bigger 18 and 19 micron volumes dragging Merino supply much lower. The core crossbred category, 27 to 30 micron referred to as 28 micron in the graph, fell by a hefty 15%.
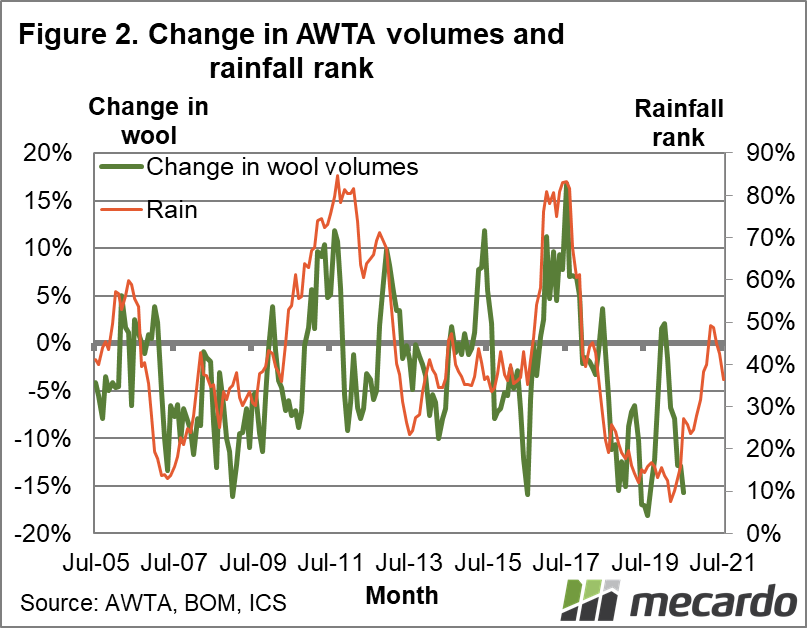
While prospects for rainfall remain uncertain as usual, the odds continue to be for rainfall to improve this spring compared to late 2019 levels simply because it was so dry in 2019 (in many regions). Figure 2 compares the year-on-year change in AWTA volumes (smoothed by three months) with the year-on-year change in the rolling 12-month rainfall rank, weighted across Australian wool production regions. The projected trend in rainfall rank (back to median levels) suggests the trend in wool production should be towards an increase by the second half of the season.
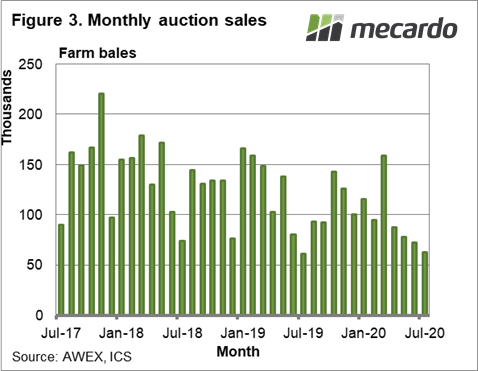
Supply is all very well but wool is grown to be sold, and demand is struggling at present not only for wool. Figure 3 shows monthly volumes (farm bales) of greasy wool sold in Australia from mid-2017 to July 2020. Volumes dip for the months of July and December, when sales are cut short due to holidays and recesses. Note the last sale of more than 150,000 bales in a month was last March. Since then, the volume of wool sold has trended lower. If we use May and June as a guide, the COVID-19 market can absorb in the range of 70,000 to 80,000 bales of wool per month. Little wonder that this week’s sale roster of 47,000 bales has caused lower prices.
During the past year, the AWTA has tested on average 136,000 farm bales per month. If we take this as the supply and assume demand can absorb 75,000 bales per month then stocks seem likely to rise by around 60,000 bales per month in the short term.

What does it mean?
The wool industry is in something of a bind. We don’t want production to fall as in the long run the supply chain needs increased volumes of wool, but demand has been hit badly by COVID-19 and is below production levels. For the time being it looks as though farmer stocks will continue rise, by how much depends on where production settles at and how well demand can weather the pandemic storm.
Have any questions or comments?
Key Points
- AWTA volumes were down 15% in July and the three months to July.
- Since March it appears that demand can absorb between 70,000 and 80,000 bales per month.
- Production in Australia is close to 136,000 farm bales per month, so stock levels are likely to continue increasing in the short term.
Click on graph to expand
Click on graph to expand
Click on graph to expand
Data sources: AWTA, BOM, AWEX, ICS


