
Exporters, when constructing consignments, have to pay attention to both price and specifications (micron, staple length, and staple strength, pointy of break in the middle and such). Yield is not usually a major constraint on building consignments but has been so in 2020. This article takes a look at yield in the Australian wool clip.
Yield in the Australian clip reflects seasonal conditions in the preceding 12-18 months of being shorn. There is a normal seasonal variation in yield, with the highest levels around the Christmas recess (at the end of the Australian spring) and the lowest levels around May (at the end of the Australian autumn). Major variations in seasonal conditions simply lift or lower this seasonal pattern.
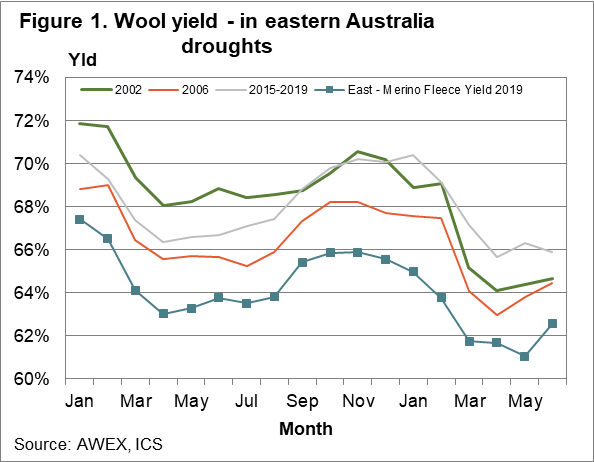
In figure 1 the eastern Australian average month Merino fleece wool yield is shown for periods of 18 months for the drought years of 2002, 2006 and the mixed years of 2015-2019 along with the past 18 months 2019 into 2020. The point here is that the full effect on yield of drought, which is primarily a failed spring in south eastern Australia, is felt in the following summer/autumn.
The seasonal pattern mentioned above shows up in Figure 1. It also shows that wool yield in 2019 and into 2020 has been tracking well below (by the order of 3-4%) previous drought levels which analysis from The University of Melbourne suggests is entirely logical (View here).
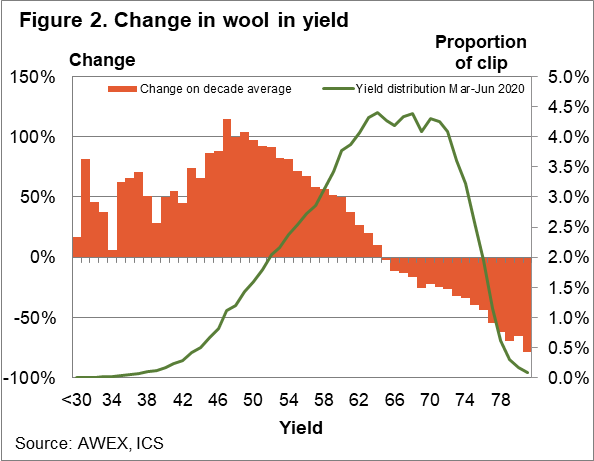
To demonstrate how the change in yield affects different yield levels, Figure 2 shows the yield distribution for March through to June (so far) 2020 compared to the average distribution for the past decade (left hand scale). Processors set their machinery to suit average specifications of wool they buy so this graph gives a feel for how far out of the norm the current yield distribution is. In addition to the issue of low yields themselves, is the extra constraint placed on the building of consignments, already tough enough in a time with limited supply and even more limited demand.
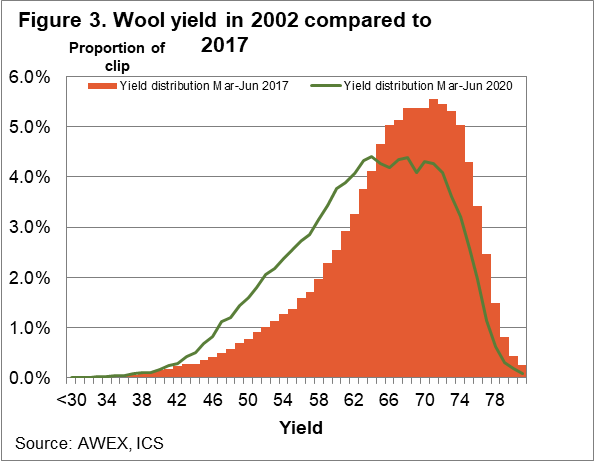
Figure 3 compares the yield distribution (all wool) for the March to June period in 2020 with the same period in 2017, following good seasonal conditions in 2016. This comparison shows that following a good season there is a lot less wool with a yield below 60%, and a lot more wool with a yield above 63-64% for exporters to draw from. Hopefully, the yield distribution in 2021 will follow that of 2017.

What does it mean?
Yield in the greasy wool market has been low for the past 18 months, with the dip down this autumn in line with past seasonal patterns but supercharged by drought in the years leading up to this autumn. To what level yield recovers in the new season will depend on spring 2020 rainfall, but the spring should bring some relief in terms of discounts for low yield (although that is a relative term). There is a reasonable chance that a lot of the wool in the growing farmer stockpile will be lower yielding, so the supply of this wool will continue to dribble into the market for some years yet.
Have any questions or comments?
Key Points
- The average Merino fleece yield in eastern Australia has been running 3-4% below earlier drought levels during the past 18 months.
- Yield will naturally increase in the next six months, in line with normal seasonal patterns.
- How far yield recovers depends greatly on spring rainfall.
Click on graph to expand
Click on graph to expand
Click on graph to expand
Data sources: AWEX, ICS


