Anyone associated with the wool market will have heard the wool proportion of total fibres, somewhere in the 1-2% range, bandied about. At best this statistic fills column space in an article and at worst is taken as a measure of the health of the industry. This article takes a look at an alternative measure.
Like most fibre groups wool has a wide range of end uses ranging from exorbitantly expensive apparel that should not be worn in a taxi (in case it wears too much) to carpets. Even with such a wide range of end uses comparing wool to non-staple fibres (filament yarns and non-wovens) does not make a lot of sense. In earlier days Woolmark would provide estimates of wool’s market share in specific categories as a better guide to the importance of wool in relevant markets, ignoring categories such as truck tyres.
For the purposes of this article an estimate has been made of the (US) dollar value of staple fibre markets (polyester staple fibre, acrylic staple fibre, cellulosics fibres, cotton and wool) by simply multiplying the gross volumes for these markets by indicator values. Admittedly this is a rough and ready approach but it is a good starting point. Annual data from the mid-1990s to 2021 was used.
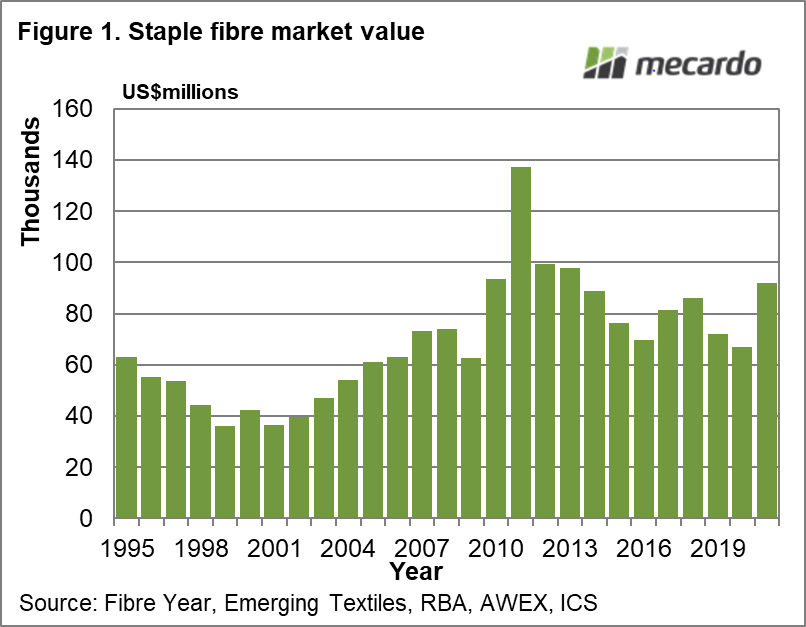
Figure 1 shows the proportion of gross value (this is akin to earlier more specific articles such as the merino gross sale value published in early March) of the selected (and main) staple fibre markets, from 1995 to 2021. An interesting point to note is the volatility in the gross value of the staple fibre markets, with the boom cotton year of 2011 a stand out. Wool is not the only fibre with a varying value between years. In recent years the value of the staple fibre markets has been in the range of US$67 to US$92 billion dollars. This value is at the raw fibre level. Further downstream processing would soon ramp the value of these fibres up to much higher levels.
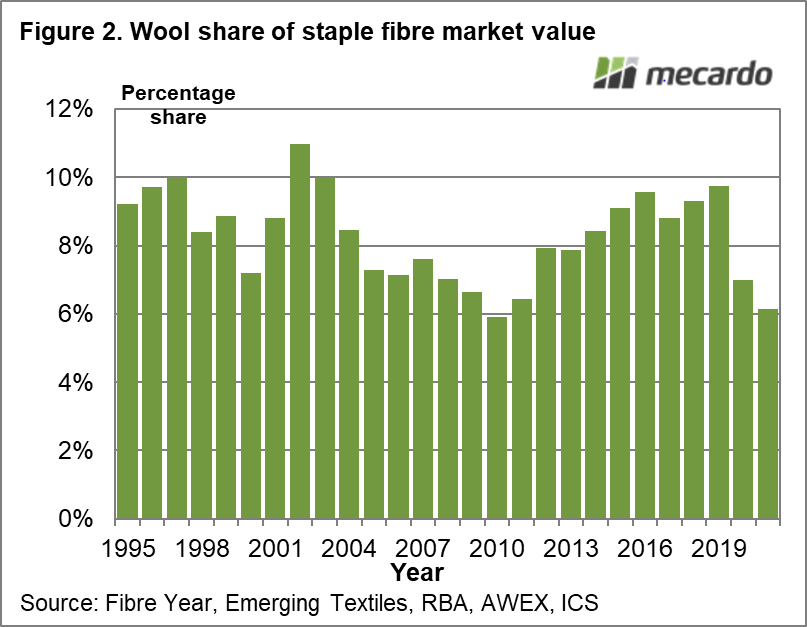
In Figure 2 the proportion of wool sales of the total staple fibre markets is given. This proportion has ranged from 6% to 11% during the past quarter of a century, averaging 9% during the past decade, with a slight downward trend. A 9% share of value of a big fibre market provides a different perspective to the standard number bandied around.

What does it mean?
Market share is a dubious statistic for farmers to concern themselves with at the best of times but if the wool market wants to discuss such measures then it is best to compare wool to like markets. In terms of staple fibre markets wool has averaged 9% of the gross value of these raw fibres during the past decade.
Have any questions or comments?

Key Points
- When the value of wool sold in a year is compared to staple fibres, the market share has averaged 9% during the past decade.
- Staple fibres included in this analysis included cotton, polyester, acrylic and wool, with apologies to other animal sourced staple fibres.
Click on figure to expand
Click on figure to expand
Data sources:
Fibre Year, Emerging Textiles, RBA, AWEX