Over the last couple months, the main focus on what is driving Aussie cattle prices has primarily been the supply situation. Today we take a closer look at how yardings have been travelling, particularly, the differential between the north and the southern regions.
You might have noticed that Meat and Livestock Australia (MLA) have made some significant changes to how they present Australian livestock data over the past year or so. The new, modern big data powered interactive dashboards are a lot more user friendly, and have made the information much more accessible to a wider audience.
One new feature that has emerged recently has been an enhanced National yardings dashboard, which now enables us to compare, and drill further down into exactly where and how cattle are being sold across the country, to a level of detail that previously was not readily available.
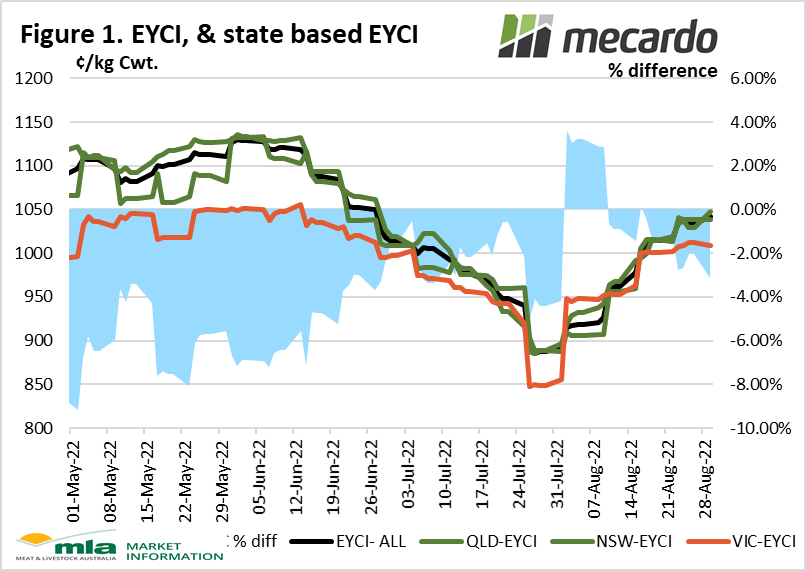
The supply situation should always be considered in context of what matters most – price. So firstly, let’s quickly recap the rollercoaster ride that Eastern Young Cattle Indicator (EYCI) has been on over the past couple months.
The start of June marked the most recent high of 1,130¢/kg cwt, at which point a combination of high supply and subdued demand pushed prices down over 21% to their lowest trough of 885¢/kg at the end of July. Since then, the market has recovered ~17% back to 1,041¢/kg cwt. One point to note however, is that since the last June peak, prices for young cattle across the country have converged substantially, with the discount evident in VIC contracting from 7% to under 3% currently. (figure 1)
One thing to remember is that the MLA NLRS yardings data doesn’t tell us the whole story about cattle supply in Australia as it only covers saleyard transactions, which is the channel through which only 10% of cattle are transacted. The majority are through private offmarket transactions, like over the hooks (OTH) for finished cattle, and paddock sales privately arranged by savvy and well-connected livestock agents. As such, keep in mind, that the saleyards predominantly directly represent the restocker market.
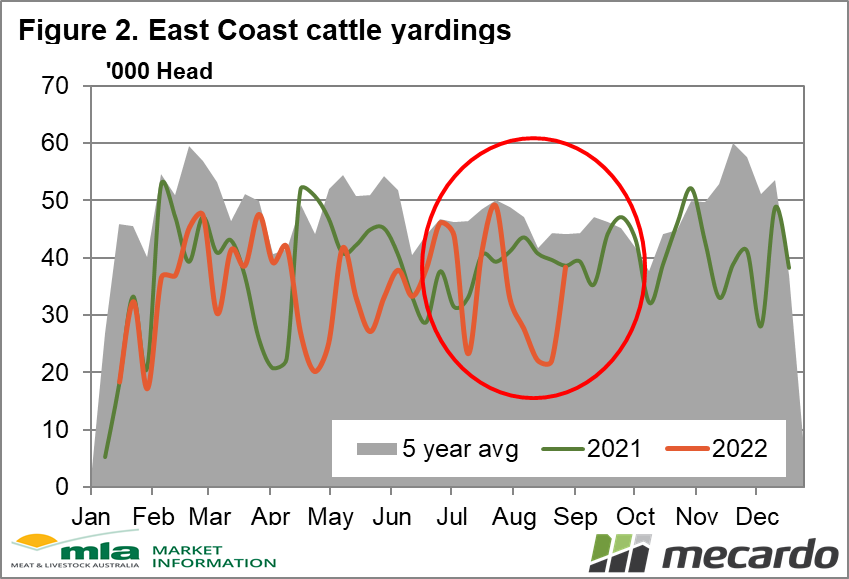
If we consider total east coast yardings between June and July, (figure 2) we can see that monthly cattle supply began to track above average in June, coinciding with the price falls we saw since that period, suggesting that increased numbers put downward pressure on young cattle prices. Case in point, the NLRS dashboard indicates that Roma Store saw its highest yardings in three years, at 9,751 head on July 22nd,the week when the EYCI plunged 6%, to its’ lowest point this year. Volumes dropped in August, particularly early in the month, where we saw strong price rises in the EYCI. At present, we are only now getting back to a national throughput level that looks even remotely normal.
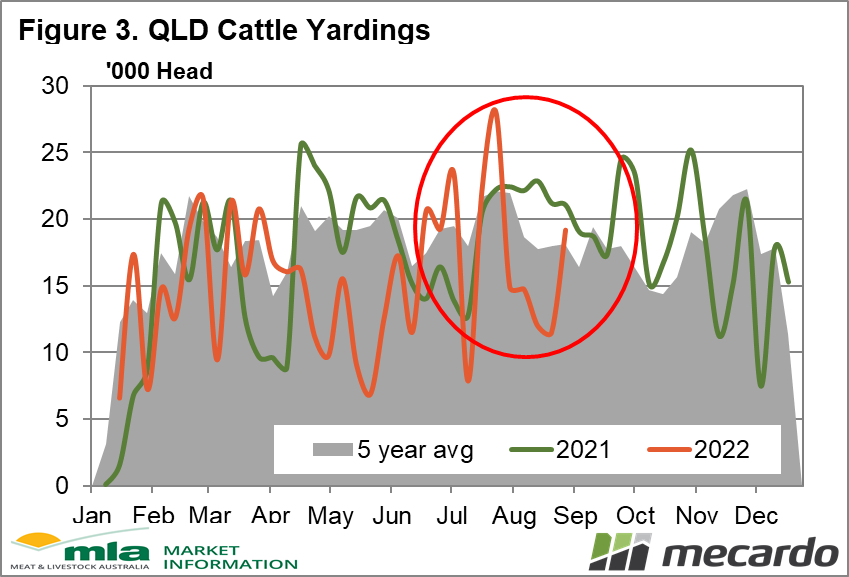
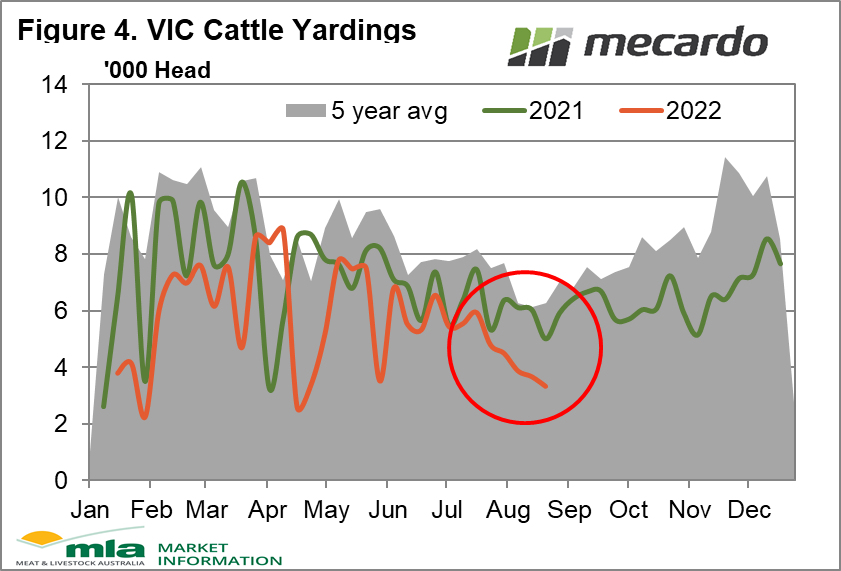
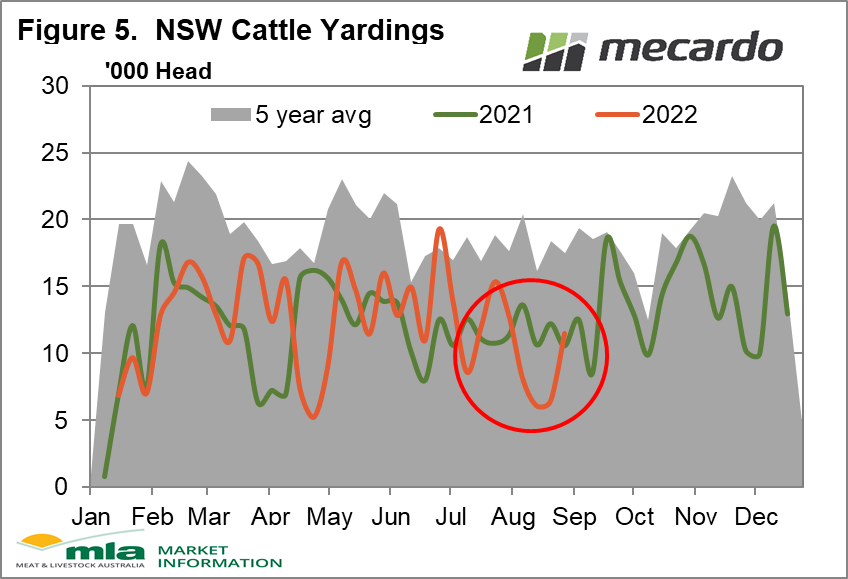
However, the numbers have only really come back in the QLD region, where they came in above the 5-year average last week (figure 3). In contrast, NSW throughput is still historically low, at 34% under the average (figure 5). Moving further south, VIC supply is travelling at a level 47% below average, and 33% below where it was in 2021. (figure 4)
Overall, the lower numbers being offered in the south might be indicative of producers being reluctant to market wintery condition cattle into a relatively depressed market, especially when there is the promise of an extended La Niña weather system on the cards and a strong outlook for pastoral conditions, and good weight gains.

What does it mean?
Being highly mindful of what is happening to the cattle supply situation is essential when considering the overall context of what price movements are really indicating about the state of the marketplace. MLA’s new yardings dashboard provides a wealth of information that is highly accessible. Supply seems to be back now, and prices have held, which is an encouraging sign of confidence in the market.
Have any questions or comments?

Key Points
- MLA has a new & improved national cattle yardings dashboard.
- A surge, then contraction in supply has been a huge contributor to the recent price rollercoaster ride .
- Price premiums in the north have reduced substantially in recent months.
Click on figure to expand
Click on figure to expand
Click on figure to expand
Click on figure to expand
Click on figure to expand
Data sources: MLA, Mecardo