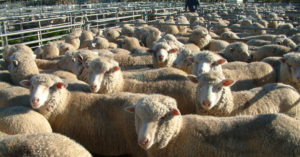
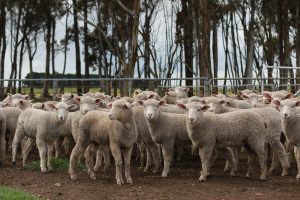
With August already upon us, Spring is in the air, and the first of our new season lambs born as early as this March are beginning to trickle through the saleyards. The influx of young lambs takes a fairly predictable pattern each year, starting north, and working its way down south.
Tsunamis, or tidal waves are typically associated with disaster, and with Vic processing restricted by the mask of COVID-19, the question on everyone’s minds is whether our abattoirs have the ability to deliver the slaughter rates the industry needs over this critical period. The following question is what it could do to prices and the ability to profit from fattening lambs, or cashing out early.
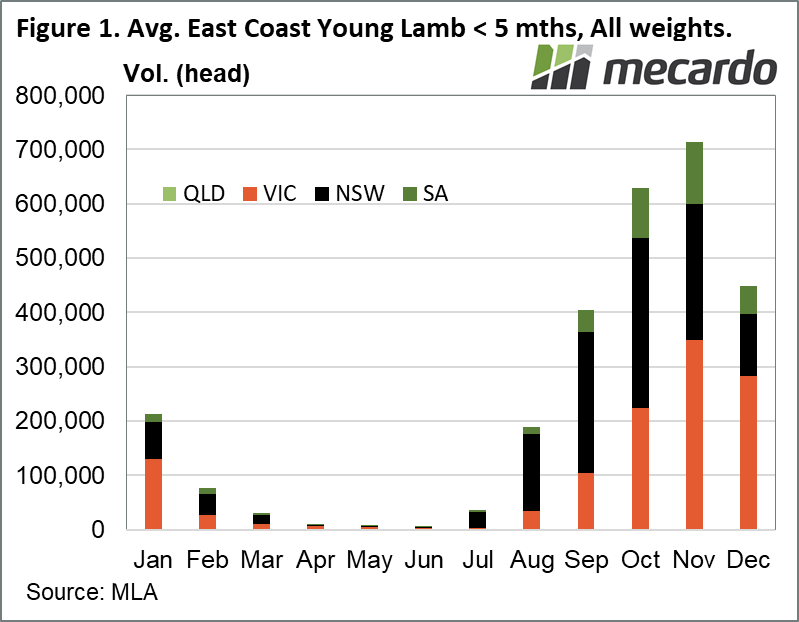
The average total number of new season lambs coming to saleyards, across all categories including restockers each year from 2017-2019 has been in the region of 2.8 million on the east coast (Figure 1). However, 2019 was a drought year, where we saw about 10% less lambs offered for sale than 2018, and 25% less than in 2017.
It is useful to look at the whole lamb picture to get an idea of how many could potentially come though the saleyards, and when. What would have fitted into restocker categories in previous years could well be a lot heavier this year.
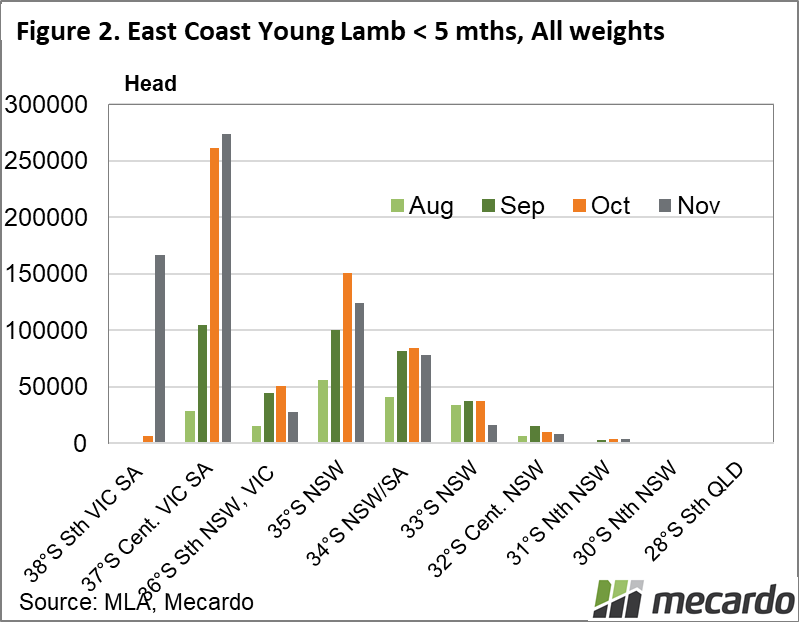
Conditions in 2020 have almost never been better in the last 10 years. Ewe fertility, and lamb survival rates in these excellent times are expected to be higher, as fodder for the lactating ewes has been plentiful. One would expect with conditions so good that lambs may also grow faster, demonstrating their true genetic potential this season also. This suggests that the 2020 lamb wave may be skewed more in the direction of August/September. Looking at Figure 2, we can see that the flushes of lambs to market occur at different times, and the further south you go, the later the lambs tend to be offered up to market.
Remembering off hand the locations and latitudes of saleyards across the country is probably not high on most people’s strong skills, so here’s a list below for reference when looking at the graph.
- 38°S Southern VIC, SA: Hamilton-Mt Gambier
- 37°S Central VIC, SA: Bendigo-Ballarat-Narracorte
- 36°S Southern NSW, VIC: Corowa-Deniliquin-Shepparton
- 35°S Southern NSW: Wagga-Coota-Yass
- 34°S Southern NSW: SA: Carcoar -Cowra-Griffith
- 33°S Central NSW: Forbes
- 32°S Central NSW: Dubbo-Narromine
- 31°S Northern NSW: Tamworth
- 30°S Northern NSW: Inverell-Guyra
- 28°S Southern QLD: Warwick
For example, down at 38°S; at Hamilton and Mt Gambier, the deep south of VIC and SA; most young new season lambs are offered to market late in the piece, in November. It is a similar story a little further north, In central VIC’s Ballarat and Bendigo, with a major acceleration of new lamb marketing in October & November. Further North, into NSW, you can see that there is a much greater proportion of lambs being offloaded earlier, in August and September.
Most of this pattern is all about expectations of conditions in the paddock, and producers’ decisions earlier in the year as to when to join their ewes to maximise survival and profitability of their enterprise.
There is also the question of where all the lamb will go – historically, one of our key export market overs this period of heavy supply has been the middle east, which took close to 30% of our exports. The middle east’s oil-based economy is suffering due to lower oil production rates, depressed oil prices stemming from the global slowdown, and that has shown up in much weaker export volumes to the arabian part of the world. In contrast however, Asia has become more significant, now taking around 45% of our exports in 2020, with exports to China still keeping pace with last year.
I was having a conversation this morning with Andrew Woods, our resident Wool Guru, about how the last major experience of rising wool stocks in the 90’s showed that wool bales tend to store quite well for years in a dry shed, with little to no degradation. Needless to say, lambs don’t store too well, regardless of how dry your shed is. Not all lambs are equal though, and some take longer to grow and be turned off than others due to genetics and growing conditions. These are reflected in the “old season” lambs seen coming to market.
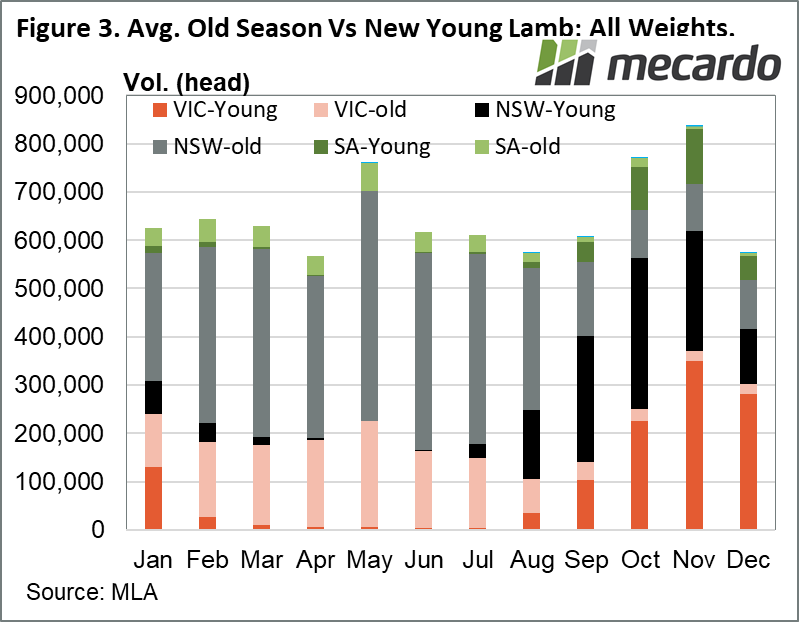
Old season lambs make up over 2/3 of the total saleyard lamb transactions over the year. Over the 2017-2019 period, the average annual 5m head of “old season” lambs that are in excess of 5 months old dominate the saleyards for most of the year, till they tail off to give way to new season lambs around August to September (Figure 3).
While total offerings tended to look pretty stable at around 600K per month, by the months of October and November, the flood of new young lambs become a torrent, while old lambs retreat to a trickle, but total numbers still spike by 20-30%, before pulling back in December. Also, remember that these figures only cover just the lambs coming through saleyards, inclusive of non-trade weights restocker animals, which have been about 50% of the volume over the August to November period. As I mentioned before, another, larger sized regiment are also going via over the hooks into processors on top of this.
What does it mean?
Young spring lambs enter the east coast marketplace in a fairly predictable pattern, and put pressure on prices. Consider this typical state of affairs when looking at restocking and selling decisions, particularly given your location in the country, as local effects on prices can be relevant.
There are times in the market when buying well-bred young lambs with excellent genetics makes sense if conditions are good, and your property is looking lush. Normally it’s an easier decision to make than it is right now, given that most producers actually have more choice this year, and capacity to slaughter is still an unknown.
Have any questions or comments?
Key Points
- Around 2.8 million young lambs expected to be offerd up in salyeards in 2020
- Wave of lambs starts up in northern NSW, moves downward.
- Lamb trade is dominated by over the hooks sales- estimated over 60%
Click on figure to expand
Click on figure to expand
Click on figure to expand
Data sources: MLA, Mecardo


