A suggestion was made recently for an article to look at the change in price levels across a range of agricultural commodity prices during the past two decades. Such a comparison throws up some challenges which this article looks at.
In this analysis, the commodity prices have been simply
deflated (adjusted for inflation) for both the graphics and table. The 2018
paper by David Jacks (read
here) outlines a comprehensive look at real commodity prices which involves
breaking the price series into trends, cycles and boom/bust episodes. Jack’s
paper highlights the impact of long-run (70+ years) trends and long-run cycles
(50-70 years) on commodity prices, in addition to the boom/bust episodes that
generally grab our attention. David
Jacks also provides a range of historic commodity price series on his website (see more here).
The boom/bust cycles identified by David Jacks pose a
problem for comparing price movements between commodity prices. Where do you
start or, more pertinently, who don’t you start? If the comparison begins and/or
ends in a boom or bust episode, the comparison is biased. Jacks mentions in his
paper that, “perceptions of the trajectory of real commodity prices are vitally
influenced by how long a period is being considered”.
Figure 1 shows the annual average deflated Australian sale
yard red meat prices series (EYCI, cow, mutton and lamb) from the mid-1990s
onwards relative to an average price for 2003-2005. Table 1 accompanies the
graphics in this article, showing the price variation for the nominated years
relative to the average for 2003 to 2005.
Mutton and lamb are good examples of how boom/bust episodes
can bias analysis. In Figure 1 even in the late 1990s sheep meat prices were
still low as the flock was actively shrinking (a process which began at the
collapse of the RPS in the early 1990s). While prices in recent years have
fallen considerably, and are now below 2004 levels, mutton remains twice the
(deflated) price from the mid-1990s and lamb is 57% higher.
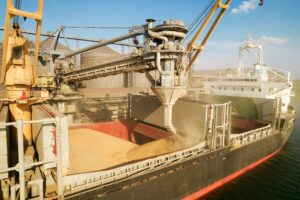
Figure 2 shows wheat and canola delated Australian price
series, and Figure 3 repeats the exercise for a range of fibre prices (merino,
28 micron and cotton).
Until 2022 there were clear upward trends in the red meat
prices, especially sheepmeat. Jacks notes in his paper that soft commodities,
including grains, have generally downward long-term trends in price. The trends
seen in Figure 1 for red meats are a function of the time period selected.
Figure 2 shows trends for wheat and canola closer to those noted by Jacks.
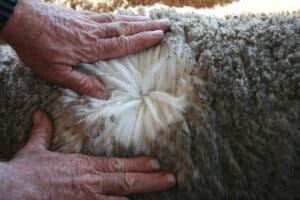
Finally, in Figure 3, the trends for cotton and 28 micron
are clearly falling, although the 28-micron trend is biased as it is in the
middle of the mother of all busts. In contrast, the merino prices have a
slightly rising trend, which is a function of changing quality (the average
merino fibre diameter becoming finer) during the three decades.
There are a couple of points to note if the reader looks at
the David Jacks deflated price series.
1.
The lamb price series used is the wholesale UK
Smithfield frozen series which is markedly different (very much higher through
the mid-20th century) to Australian saleyard series
2.
The Jacks paper uses prices in US dollar terms,
deflated by a US CPI. This seems to give a different result (a higher real
price level in the first half of the 20th century) to prices in
Australian/UK pounds and deflated by Australian CPI.

What does it mean?
Whereas 2019 was a very good year for Australian agricultural commodity prices in relation to 2003-2005, in 2024 prices are generally lower. Wheat is the only commodity with a deflated price above the 2003-2005 level. The EYCI, canola and cotton all are close to 2003-2005 deflated levels.
Have any questions or comments?

Key Points
- David Jacks finds a falling price trend for soft commodities when looked at in the long run (70+ years).
- Australian saleyard red meat prices have been trending higher in deflated terms from the mid-1990s to 2022. Now we wait to see where prices will settle on their recovery from 2023.
- Australian wheat and canola prices have had little if any trend in recent decades.
- Fibre prices have trended lower in deflated terms in recent decades, except where quality has changed as with the average merino fibre diameter.

Click on figure to expand

Click on figure to expand

Click on figure to expand

Click on figure to expand
Data sources: RBA, MLA, Crop Forecasters, Profarmer, AWEX, Cotlook, David S. Jacks, ICS, Mecardo