Australia accounts for around three-quarters of merino wool production in total. However, when the merino clip is divided by quality (be it staple length/strength, clip preparation, quality system, or fibre diameter) the smaller international clips often punch above their weight, or perhaps Australia underperforms. This article looks at the international merino clip from the perspective of mulesed and non-mulesed wool.
Australia, South Africa and Argentina have good reporting systems for their greasy wool production. The other national clips included in this “international merino clip” require some assumptions, ranging from minor to heroic. This is why the term “international” is used, a step down from a “world” merino clip which would be presumptuous given the assumptions made.
The national clips used for this article were Australia, South Africa, Argentina, (covered recently on Mecardo, read here for South Africa, here for Argentina) New Zealand, Uruguay, Chile, USA, Russia, CIS ex-Russia and China. Best estimates were made of the clean volume of these merino clips, the average fibre diameter and the spread of the micron around the average (the standard deviation) which then allowed some basic modelling of the clips to enable a combined estimate by micron category to be calculated.
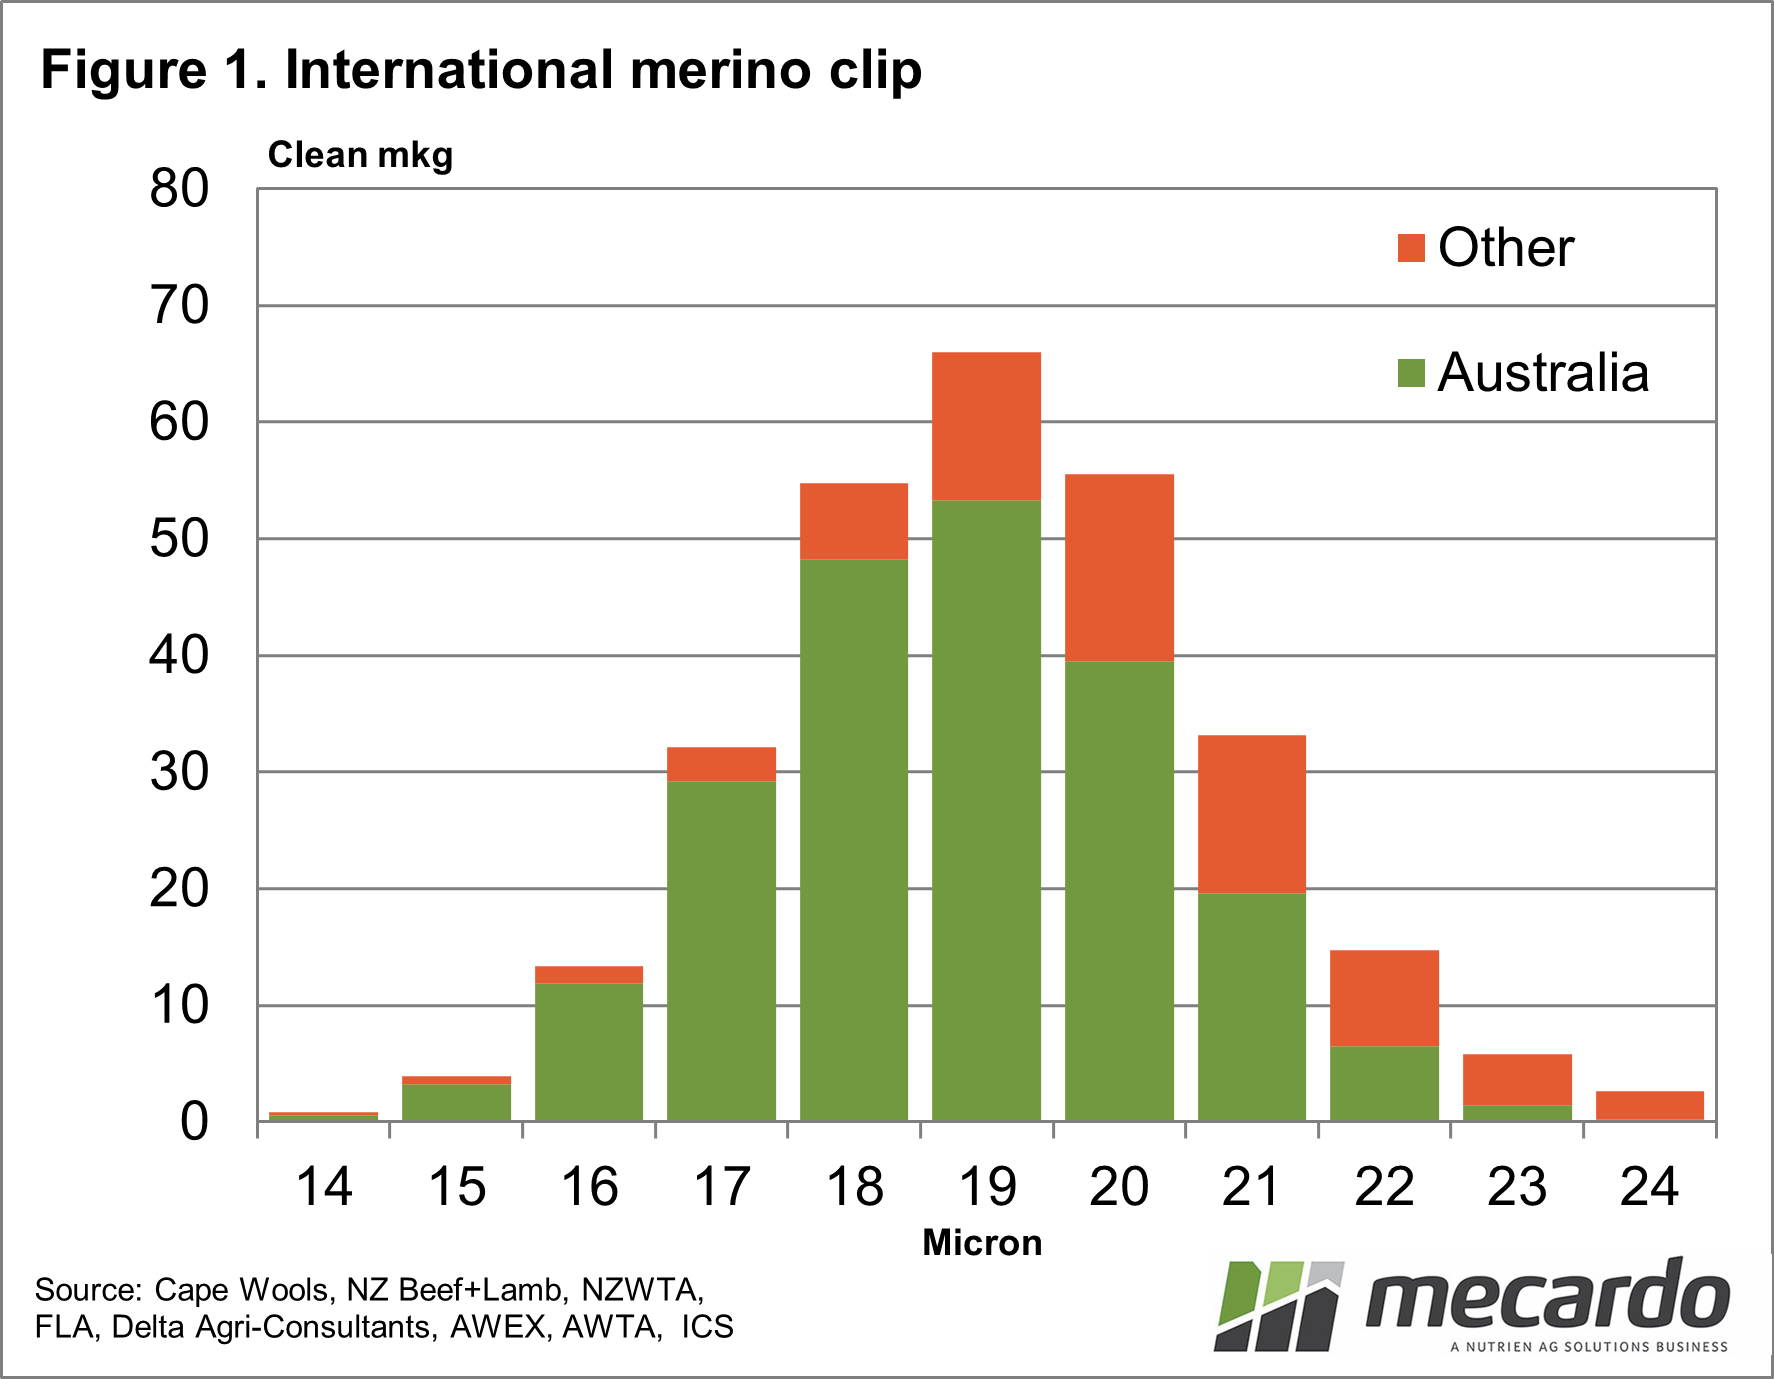
Figure 1 shows the calculated micron distribution for the international merino clip, divided into Australia and others. Australian production dominates the 20-micron and finer-micron categories, becoming less of an influence as the fibre diameter broadens beyond 20 micron. Overall Australia accounts for three-quarters of the supply.
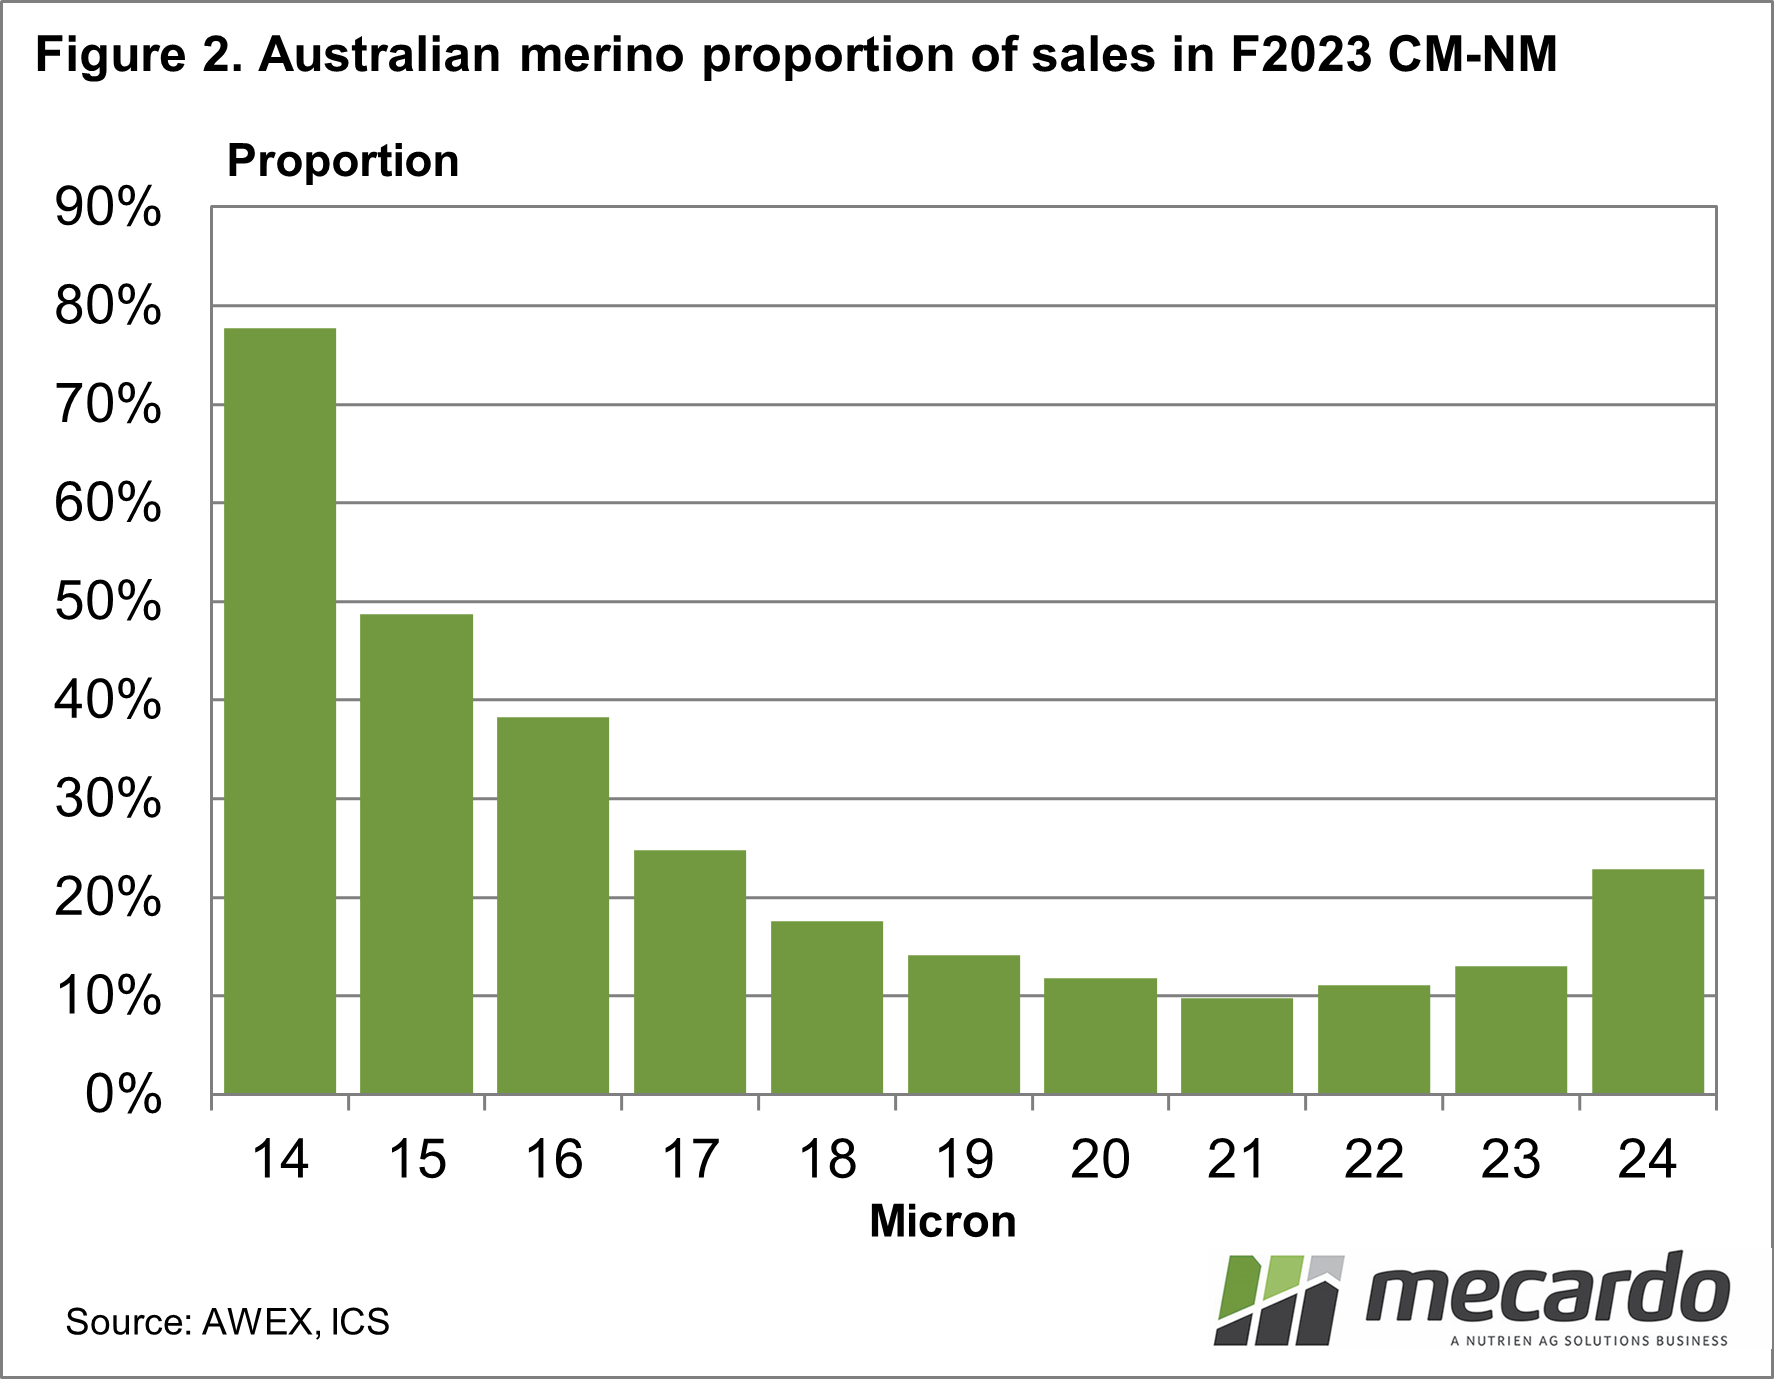
Of the clips included in the analysis, Australia is the supplier of wool from sheep that have been mulesed. Figure 2 uses AWEX auction data from last season to show the proportion of merino sales that were declared as CM-NM (Ceased Mulesing – Non-mulesing) by micron. The proportion runs from close to 80% for 14 micron (not that much wool) to around 12% to 18% for the main categories by volume (20 to 18 micron) then down to around 10% for 21 micron. Overall 17% of the Australian merino clip sold at auction last season was declared CM-NM.
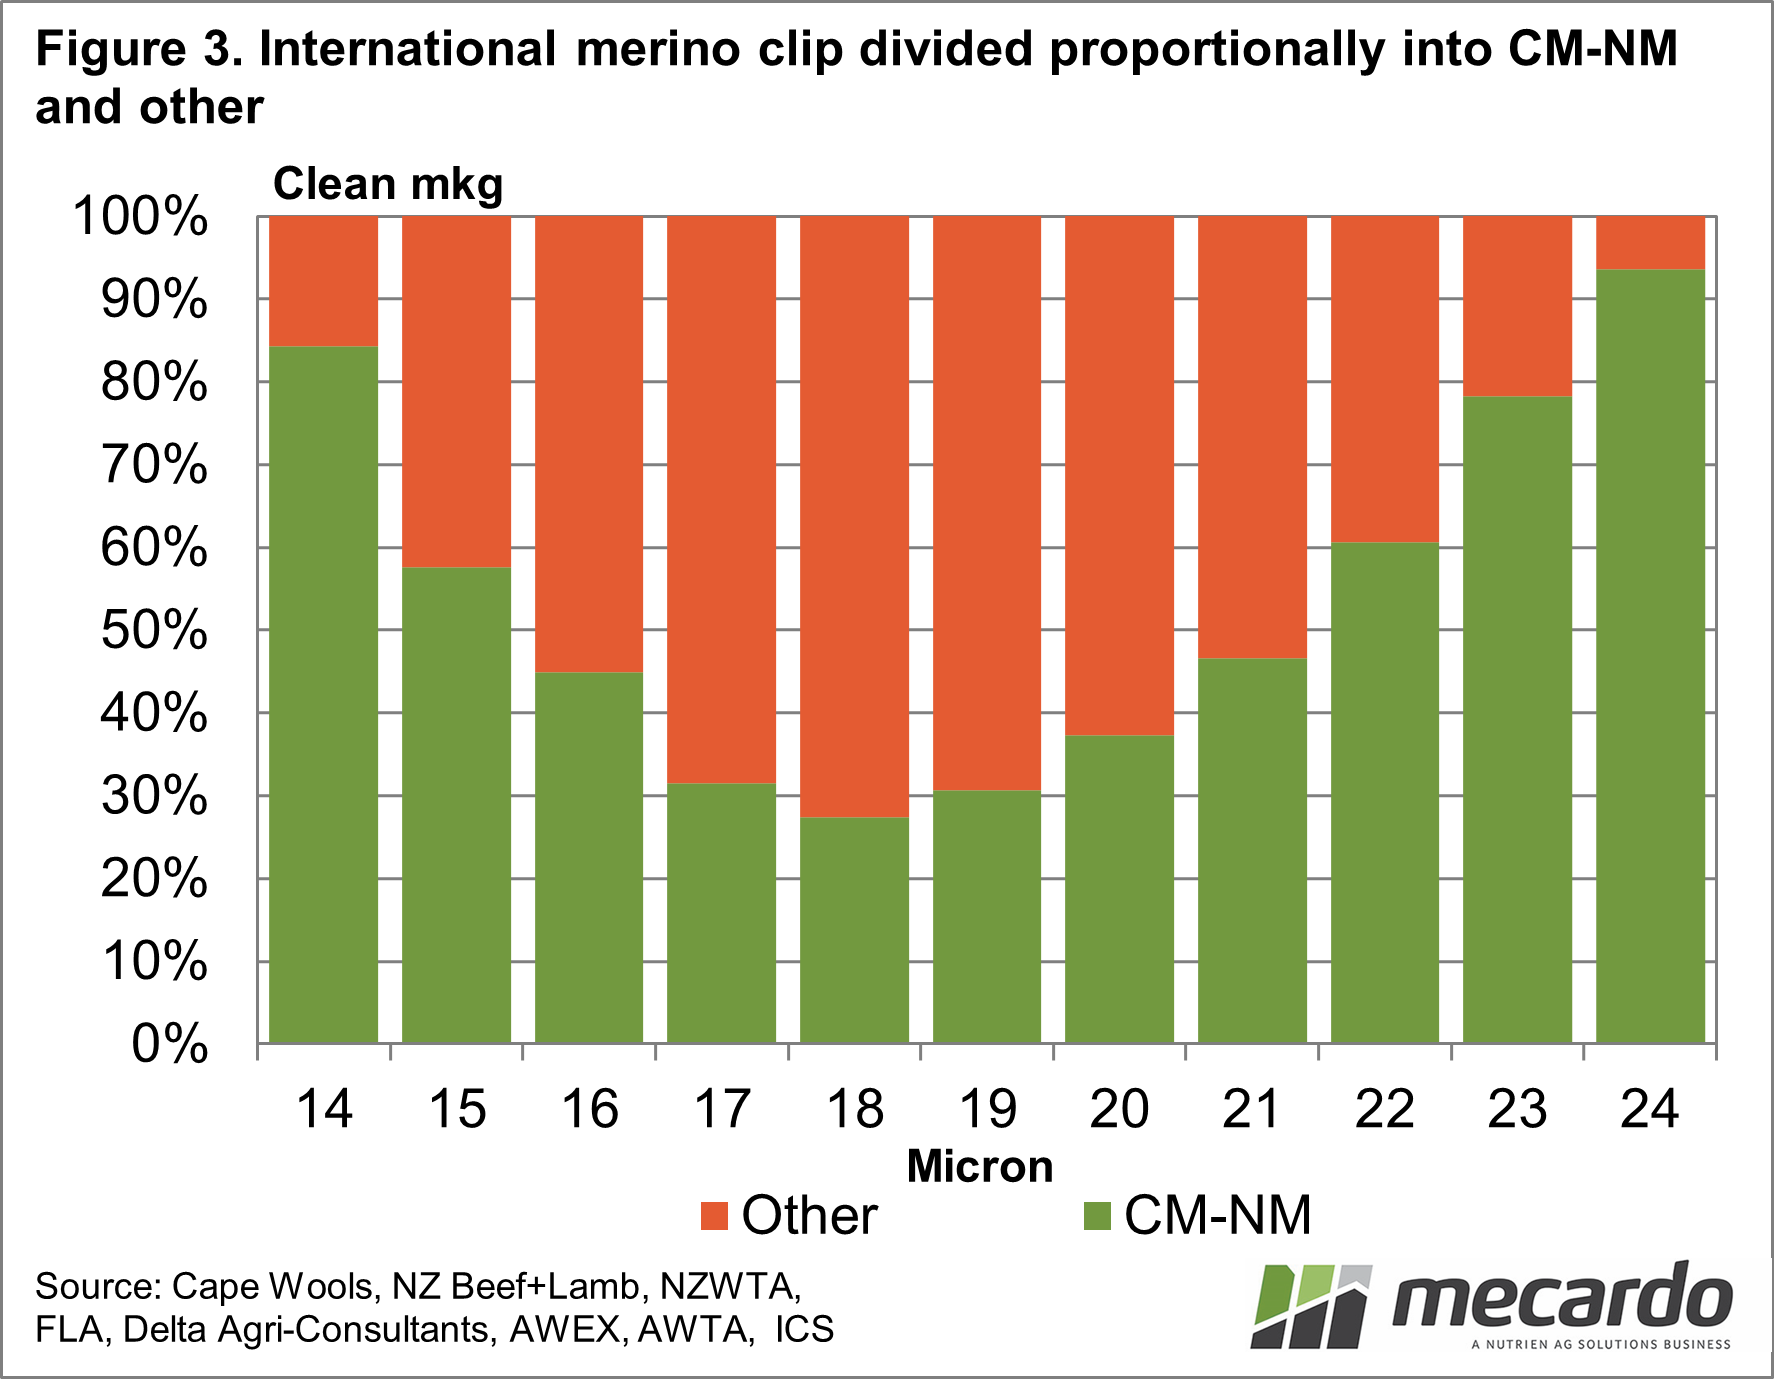
Given Australia is the supplier of wool from mulesed sheep, Figure 3 divides the international merino clip into CM-NM (from clips outside of Australia plus the Australia portion of the clip which is declared as CM-NM) and other (mulesed, non-declared, AA) by micron. This will be how the supply chains see things. The 17 to 19 micron categories have around 30% CM-NM with the proportion rising towards the fine and broad end of the merino micron distribution.
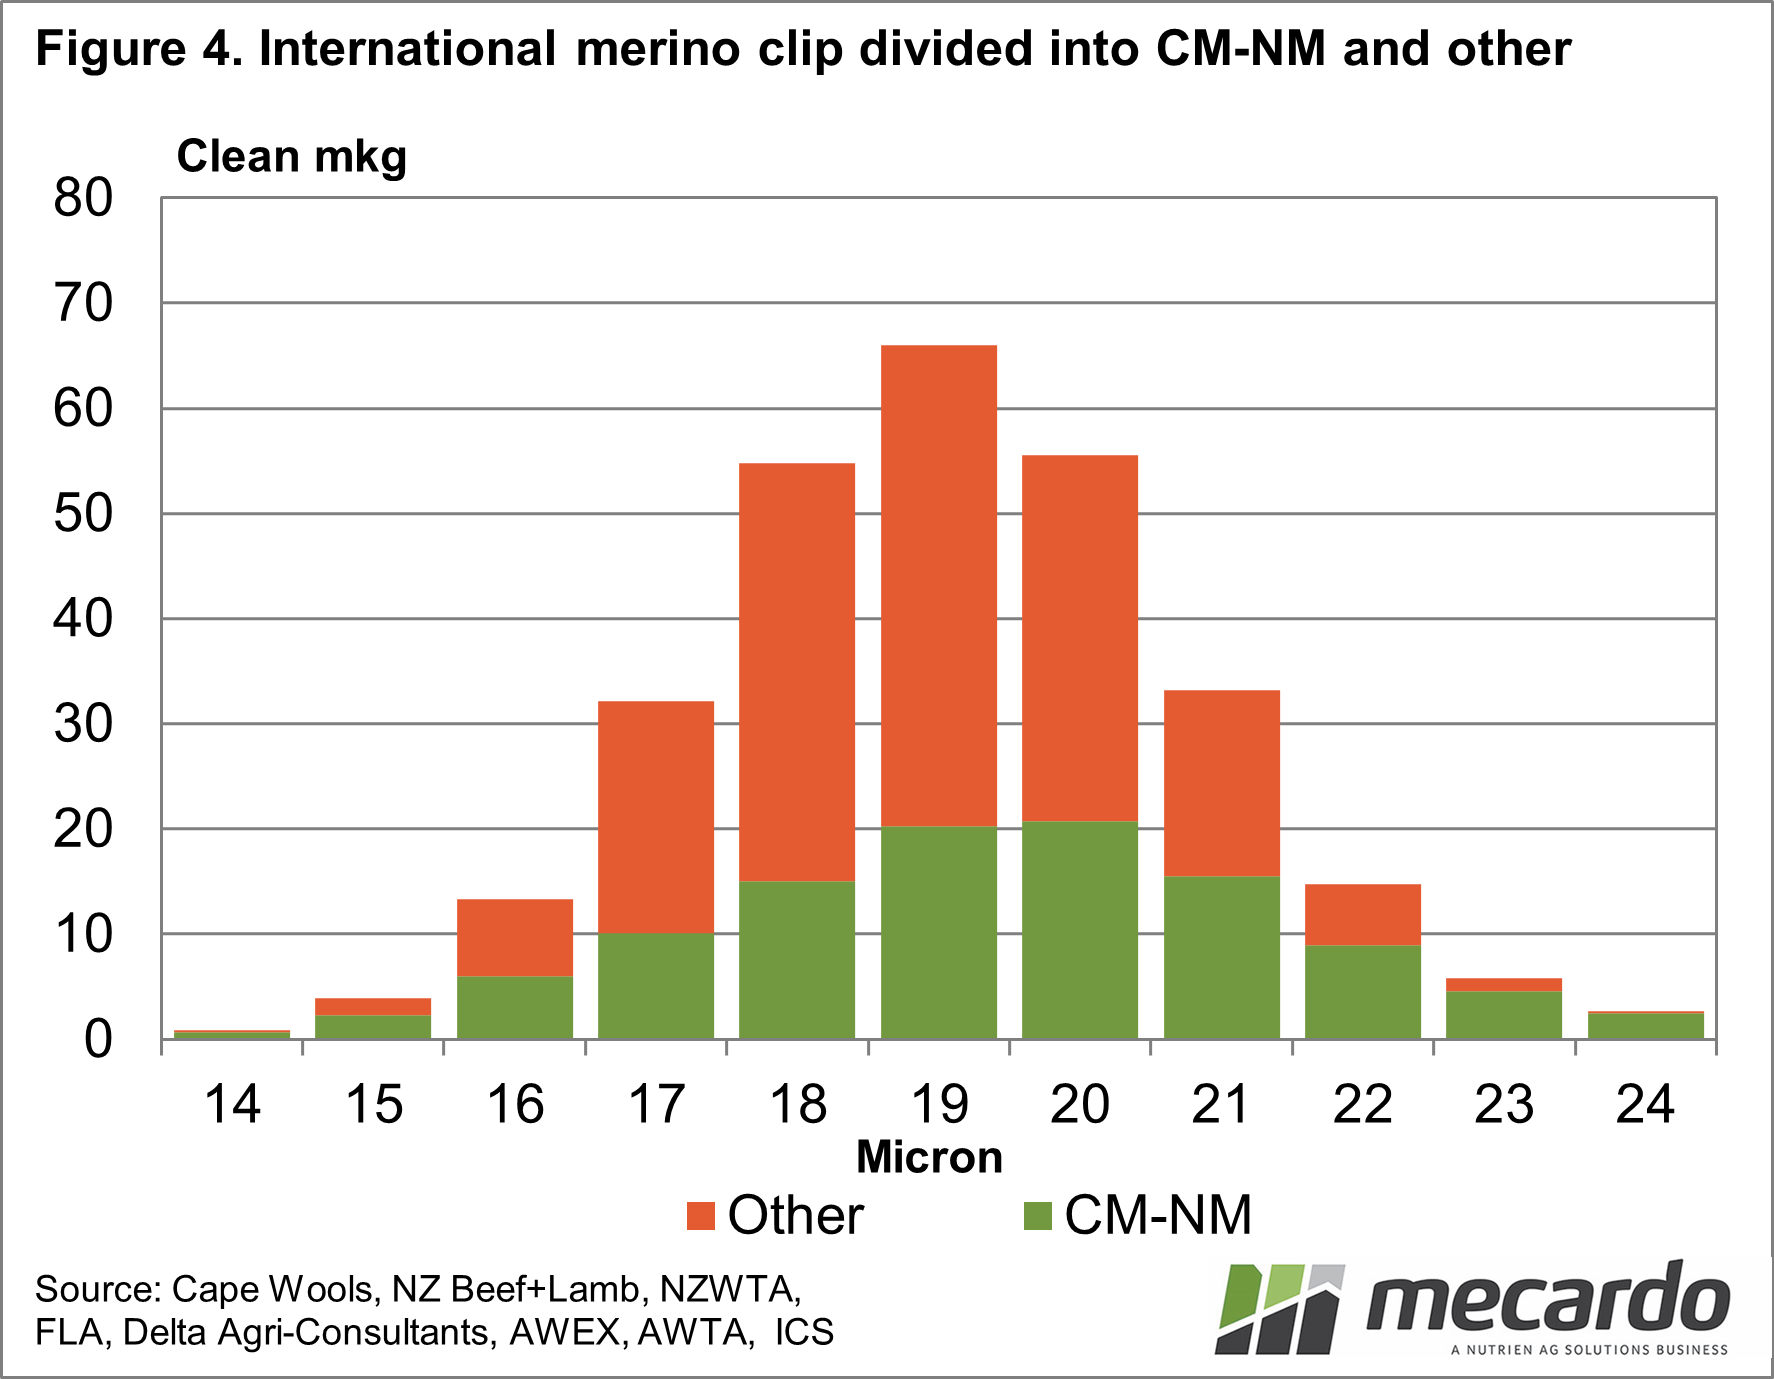
Finally, Figure 4 divides the merino micron distribution (shown in clean mkg) into CM-NM and others. The 19 and 20-micron categories have the largest supply of CM-NM wool (around 20 mkg clean each) with 18 and 21 micron each around 15 mkg clean. That split between CM-NM and others will only change if Australian production changes.

What does it mean?
If we simply split international merino production between CM-NM and others, some 38% of merino production is CM-NM although this varies greatly between micron categories. At the international levels around 84% of 14 micron is CM-NM, 32% for 17 micron, 31% for 19 micron, 47% for 21 micron and 78% for 23 micron. If the supply chain wants more CM-NM wool, somehow Australian woolgrowers will have to be coaxed into supplying it.
Have any questions or comments?

Key Points
- Australian merino production accounts for around three-quarters of international production.
- Some 17% of the Australian merino clip is CM-NM, which accounts for 35% of the international supply of CM-NM merino wool.
- The biggest micron categories of merino wool have the smallest proportions of CM-NM wool.
Click on figure to expand
Click on figure to expand
Click on figure to expand
Click on figure to expand
Data sources: Cape Wools, NZ Beef+Lamb, NZWTA, FLA, Delta Agri-Consultants, AWEX, AWTA, USDA, ICS, Mecardo