It is stating the obvious to say that wool from different geographic regions has different qualities. This stems from both the conditions in which the sheep graze and the genetics of the sheep run in the different regions. Understanding the variation in wool production by region helps to better understand wool production and its relation to variations in seasonal conditions.
One of the challenges in determining the makeup of merino clips is the range of avenues by which wool is measured and sold. AWTA data is excellent but does not provide a detailed breakdown by breed, category, and specification. Auction sale data (which covers about 85% of wool sold) provides excellent details on wool sold with one minor weakness in that some 6% of wool sold (5% by gross value) sold at auction has an indeterminate geographic origin. This means some 6% of lots do not have a precise Wool Statistical Area which tells us where the wool originates from, as the wool has been processed through a rehandle in preparation for sale.
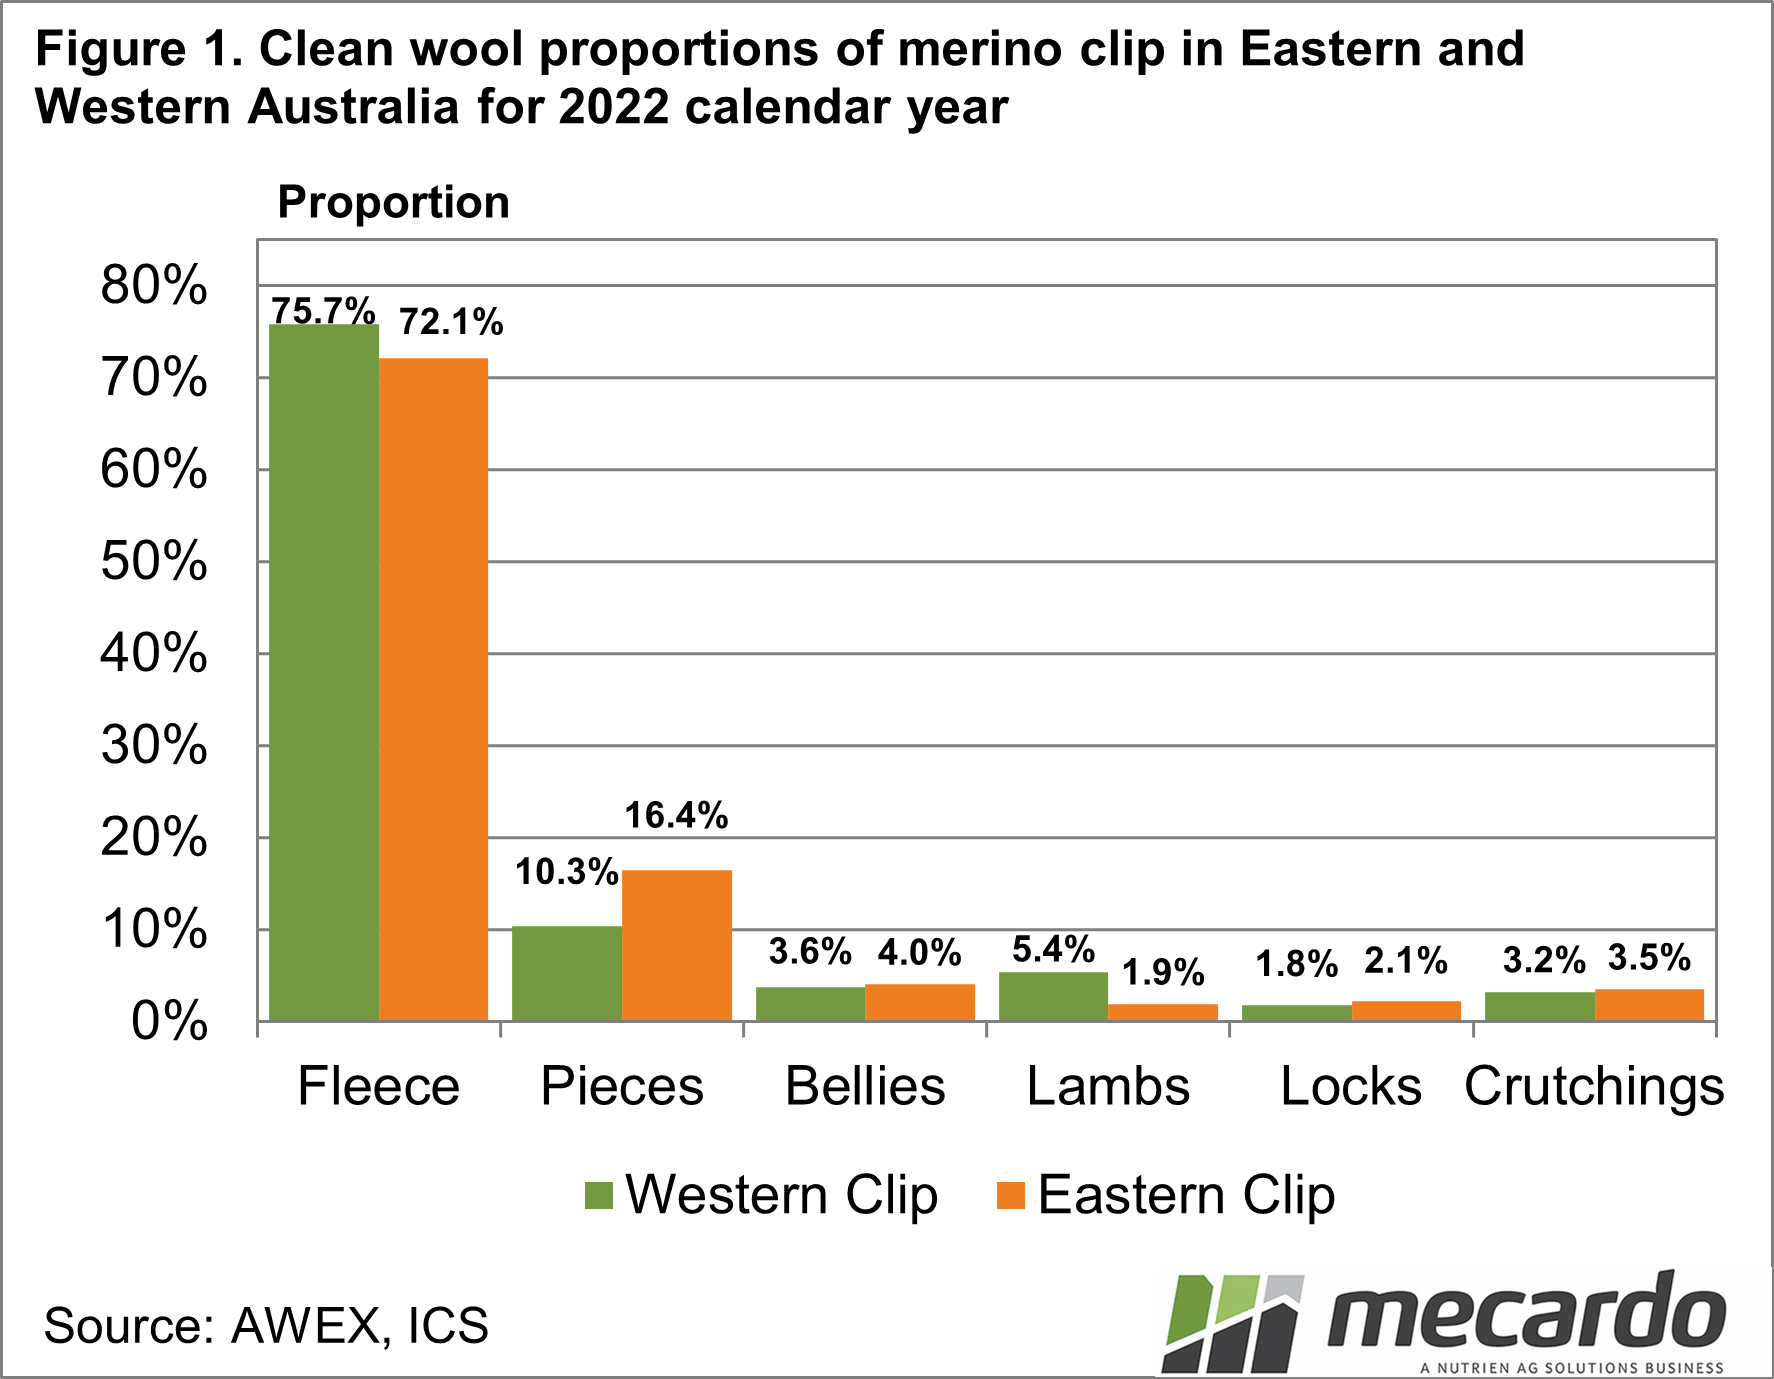
In Figure 1, a breakup of merino volumes (clean base) sold in the 2022 calendar by category, is broken down into eastern and Western Australian clips. The 6% of wool sold through rehandles can be used in this analysis as there is a clear demarcation between the eastern and western geographic areas of wool handling and wool sales. Some 21.6% of merino wool sold at auction in Australia in 2022 came from Western Australia. The Western Australians sold more merino wool as fleece, less as pieces, and more as lambswool. Crutchings, bellies, and locks proportions were similar between the east and west in 2022.
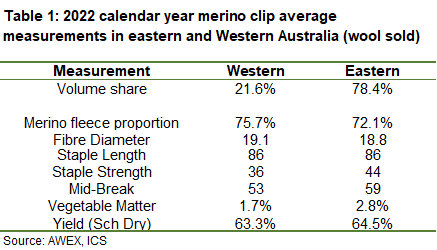
Table 1 shows the average merino wool specifications for the east and west in 2022. Some of the specifications are subject to strong influence from seasonal conditions. For example, the western merino clip has been running at 0.3 microns finer than year-earlier levels for the past six months, so the average fibre diameter shown in Table 1 for Western Australia is on the finer side and compared to an eastern clip coming off three good seasons, the difference in micron has shrunk to a small 0.3 micron. As to be expected staple strength is lower in the west, and so too was vegetable matter and yield.
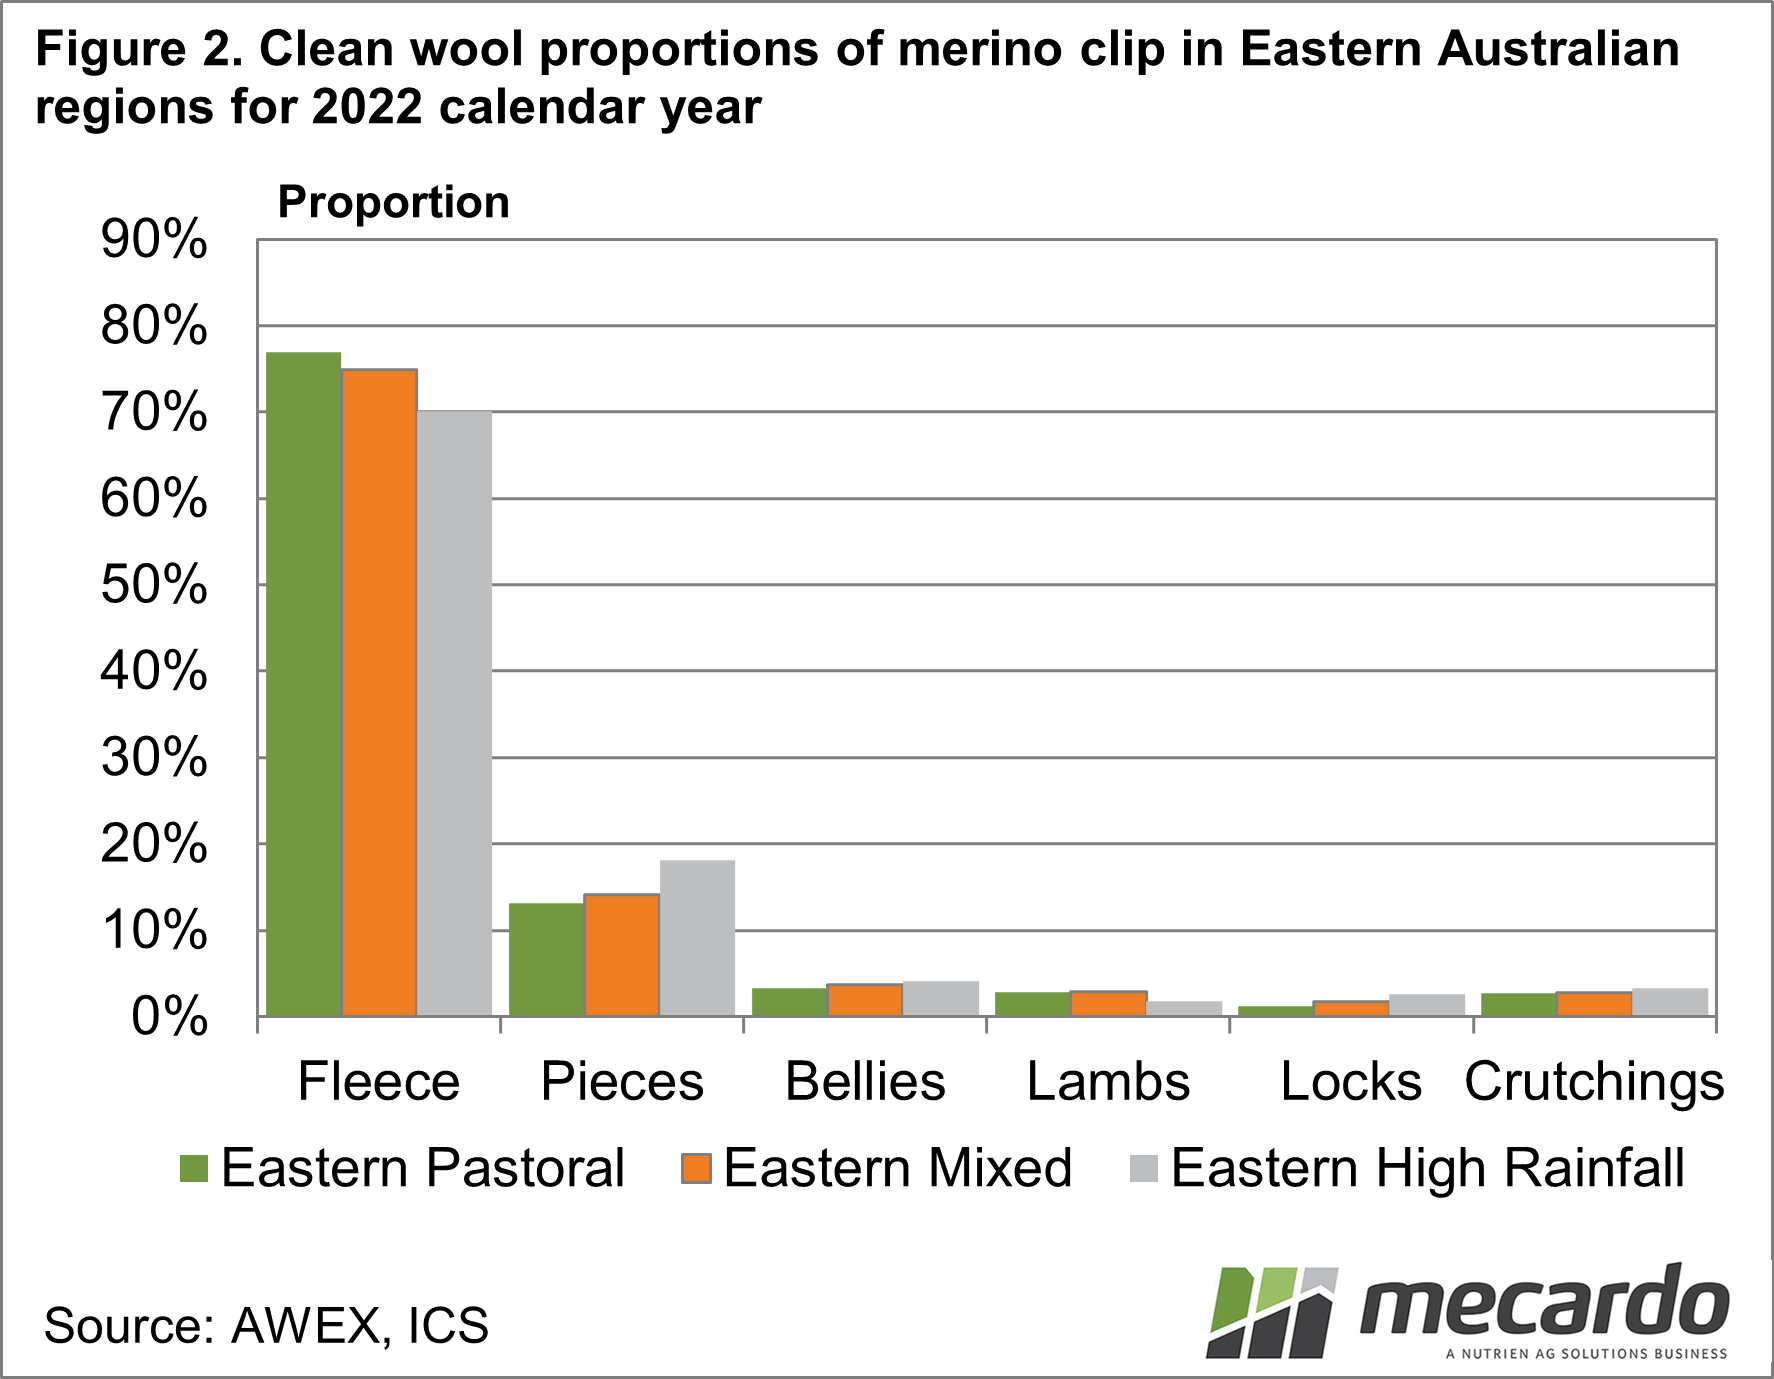
Eastern Australia is broken into three regions in Figure 2. These are pastoral (Queensland, western NSW, and northern South Australia), high rainfall (NSW tablelands, eastern Victoria, southwest Victoria), and mixed (cropping and livestock). For this exercise, the 6% of wool with indeterminate wool statistical areas has been omitted as it cannot be determined which eastern region the wool came from. The fleece proportion sold is highest in the pastoral wool allied with the lowest pieces proportion. As the fleece component falls, the pieces component rises with the high rainfall region having the lowest proportion of fleece and the highest proportion of pieces.
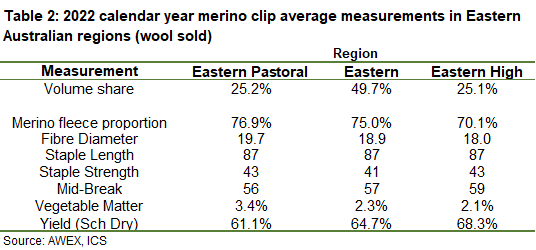
Table 2 shows the average specifications from the merino clip (in 2022) from the three eastern regions. The pastoral and high rainfall regions account for a quarter of the merino supply each, with the mixed livestock/cropping regions accounting for the other half of supply. Fibre diameter is correlated to rainfall with the micron falling as rainfall increases, so the pastoral regions have the broadest merino production. The average staple length between the regions is even, as was the staple strength and point of break in the middle. Vegetable matter was higher in the pastoral region and yield lower.

What does it mean?
The mixed cropping/livestock region in eastern Australia (and for a lot of Western Australia) is the driver in terms of merino wool production. To secure production the merino industry has to secure space in this zone. Average wool specifications for the calendar year 2022 have been fairly uniform across the regions apart from fibre diameter, which is structurally different, and the seasonally driven vegetable matter content. It shows why processors assume wool with average specifications is going to arrive for sale, and why they can get caught out when occasionally it does not.
Have any questions or comments?

Key Points
- There are no real surprises in the clip analysis with the merino fibre diameter broader for the drier regions, vegetable matter higher, and yields lower also for the drier regions.
- The Western Australian clip lines up well with the eastern mixed cropping and livestock merino clip.
Click on figure to expand
Click on figure to expand
Click on figure to expand
Click on figure to expand
Data sources: AWEX, ICS, Mecardo