Fine merino prices have been the shining light in the wool market during the past couple of years. This article looks at the recent micron premiums in comparison to the past 70 years.
A longer-term view is useful as an antidote to the shorter-term concerns which tend to overwhelm us. Although looking back 70 years might be excessive given the dramatic changes which have taken place for apparel fibres during that time. Still, an understanding of history is useful to assist in avoiding the mistakes of the past.
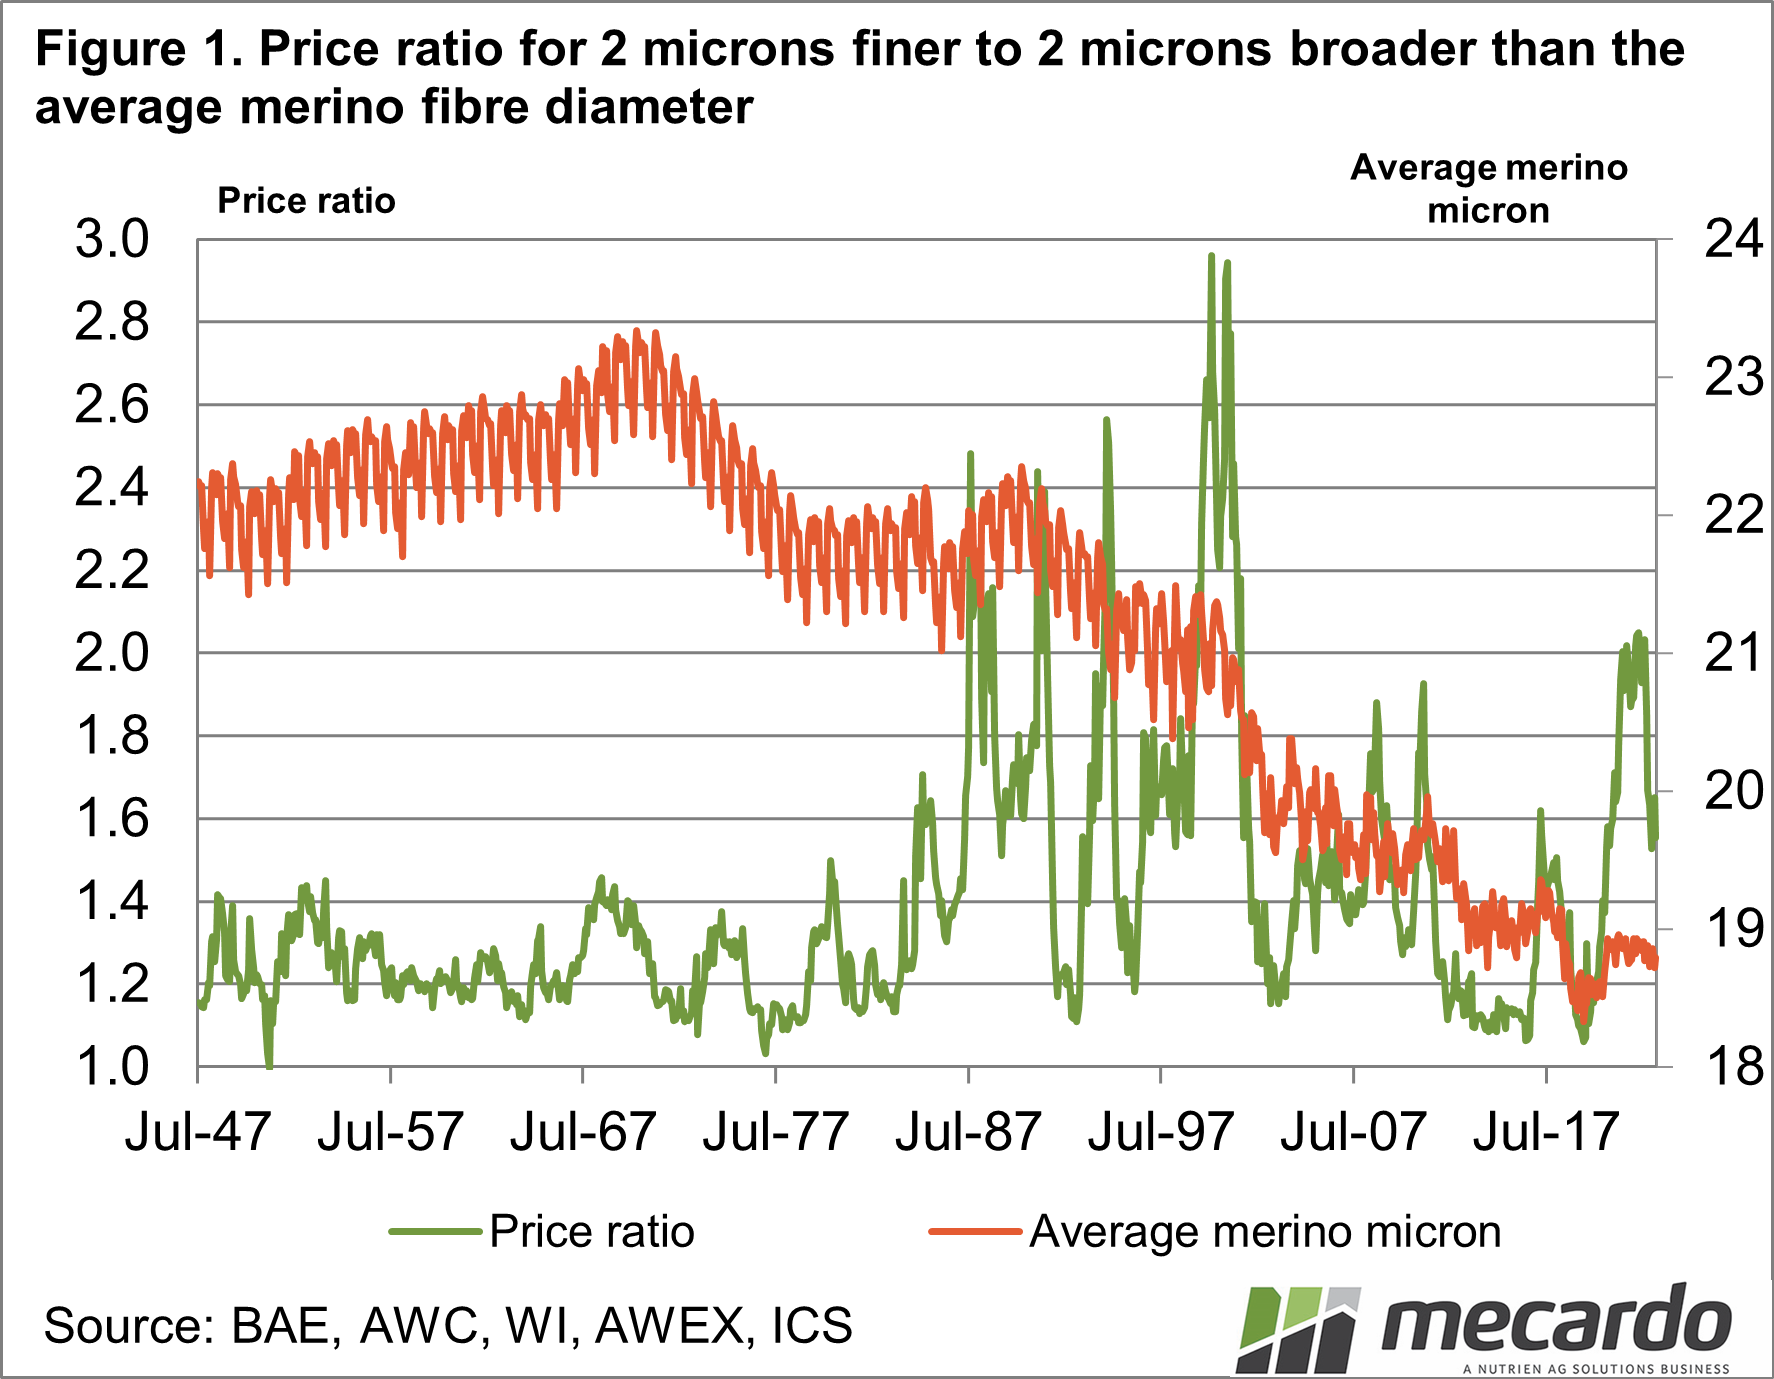
Figure 1 shows the price ratio for the micron category two microns finer than the average merino fibre diameter to two microns broader (in the current market roughly 17 to 21 microns), from 1947 to last month. In addition, it shows the average Merino micron during this period. Prior to the late 1970s /early 1980s,(by which stage most of the wool clip was tested for fibre diameter, yield and vegetable matter) estimates of the average merino fibre diameter have been made from volume records based on the old Wool Corporation types.
The price ratio in Figure 1 operated in a defined band between 1.1-1.2 and 1.4 (a premium of 10-20% up to 40%) in the three decades from the late 1940s. In the mid-1980s the price ratio widened dramatically, albeit in a volatile fashion. In the 1980s the average micron was 21-22 micron, depending on seasonal conditions. With an average of 21.5 microns, only 16% of the clip would be finer than 19.5 microns (assuming a standard deviation of 2 microns). As the wild ride in the fine micron premiums continued into the 1990s the average merino micron tells us that the supply of fine wool did not increase markedly, until after 2001.
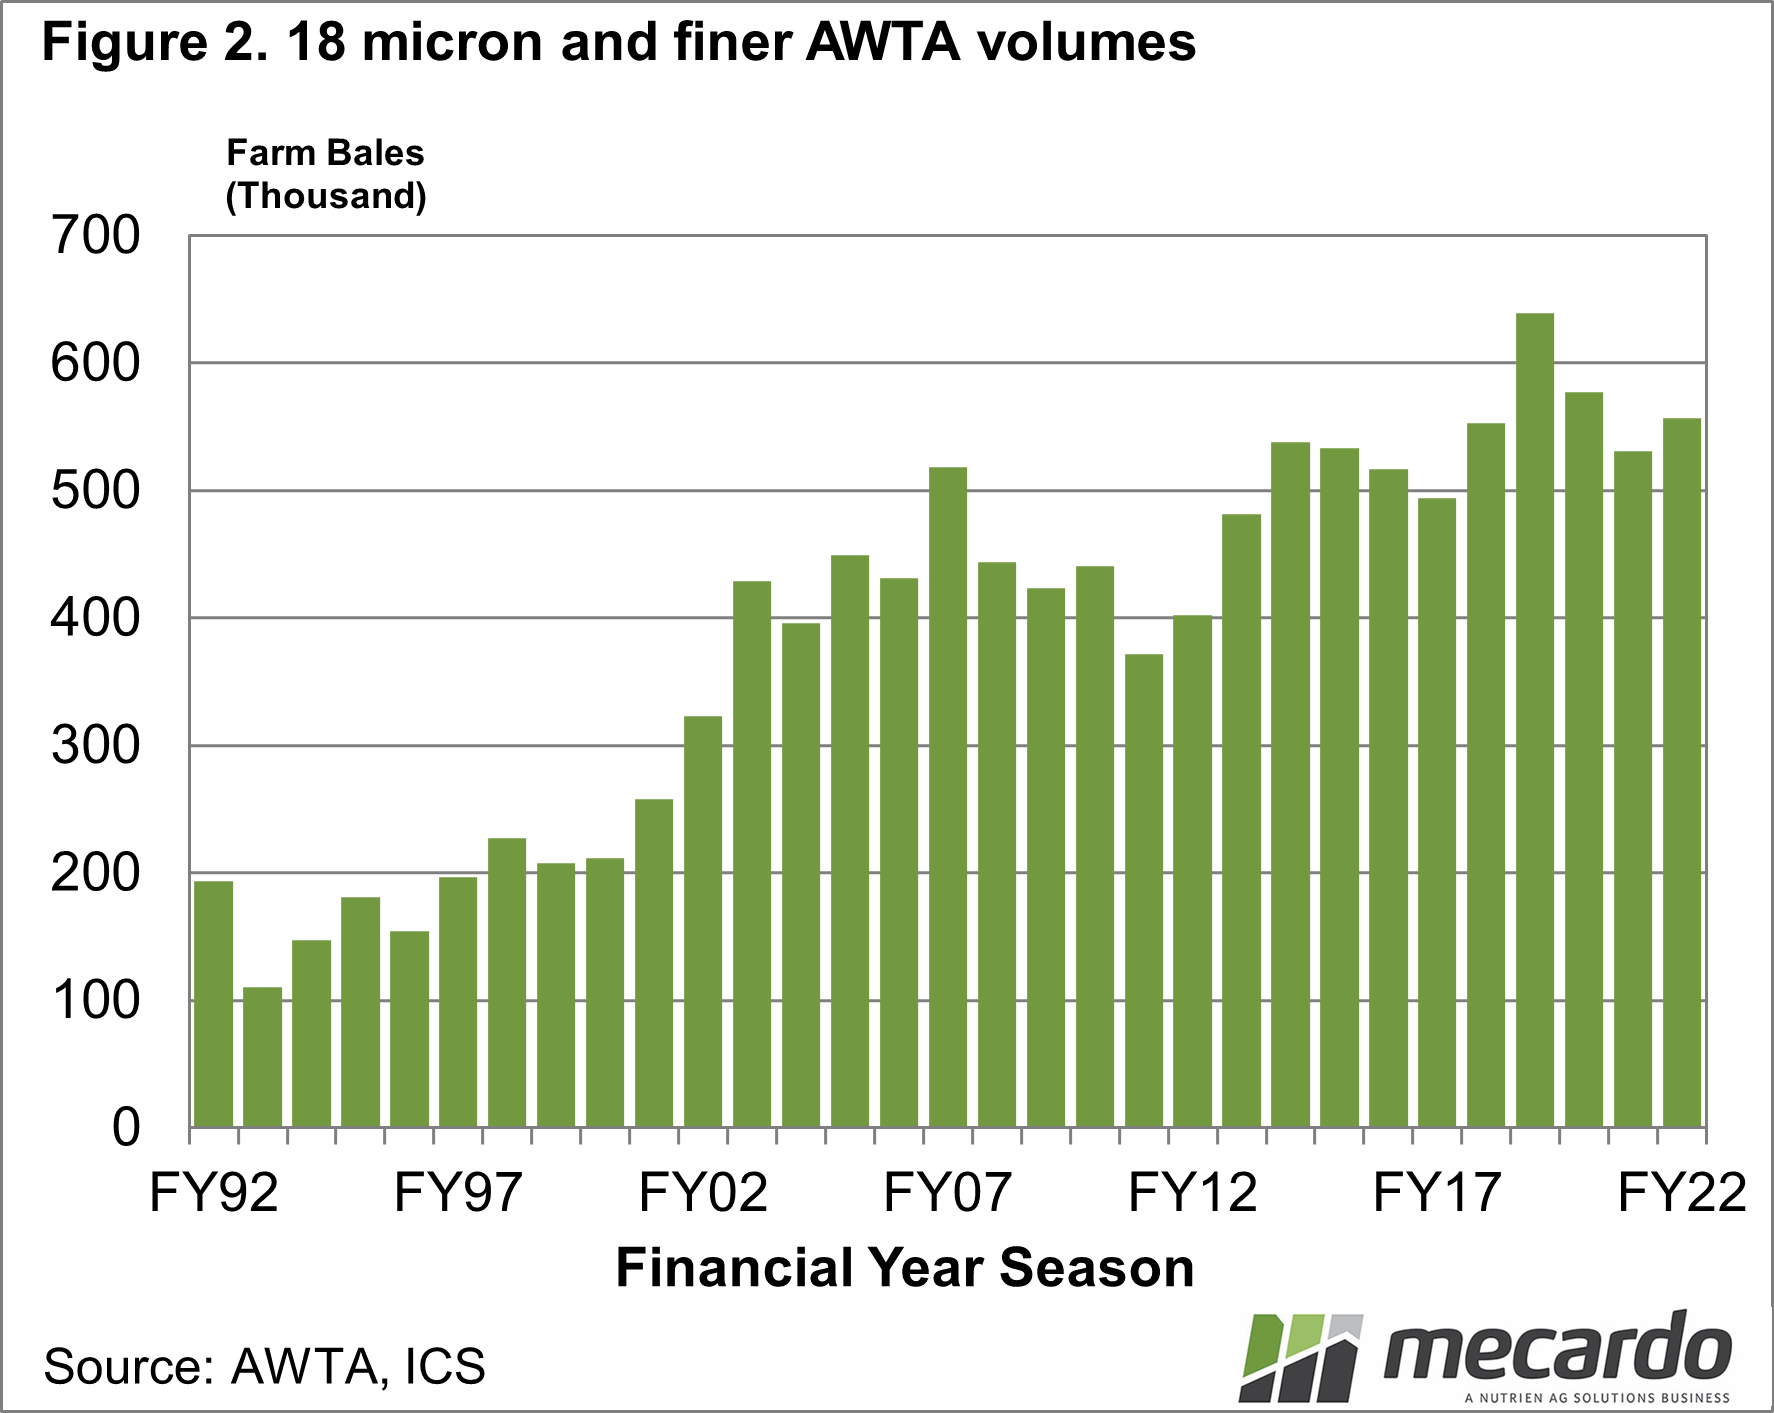
Merino production began to respond to the high premiums from 2001 onwards, by reducing the average fibre diameter. Figure 2 shows the season totals for 18 microns and finer farm bales tested by the AWTA in Australia from the early 1990s till the last season. Contrary to the general decline in broader merino volumes, the supply of fine merino wool in the two decades from the mid-1990s onwards nearly tripled. This rise in supply corresponds to the (relatively) weaker micron premiums from 2002 onwards.
The price ratio of the past two years has been the strongest performance since the 1999-2001 period in a time when there has been an ample supply of fine wool and a rebound in the broader merino supply from drought-induced lows in 2018-19 and 2019-20.
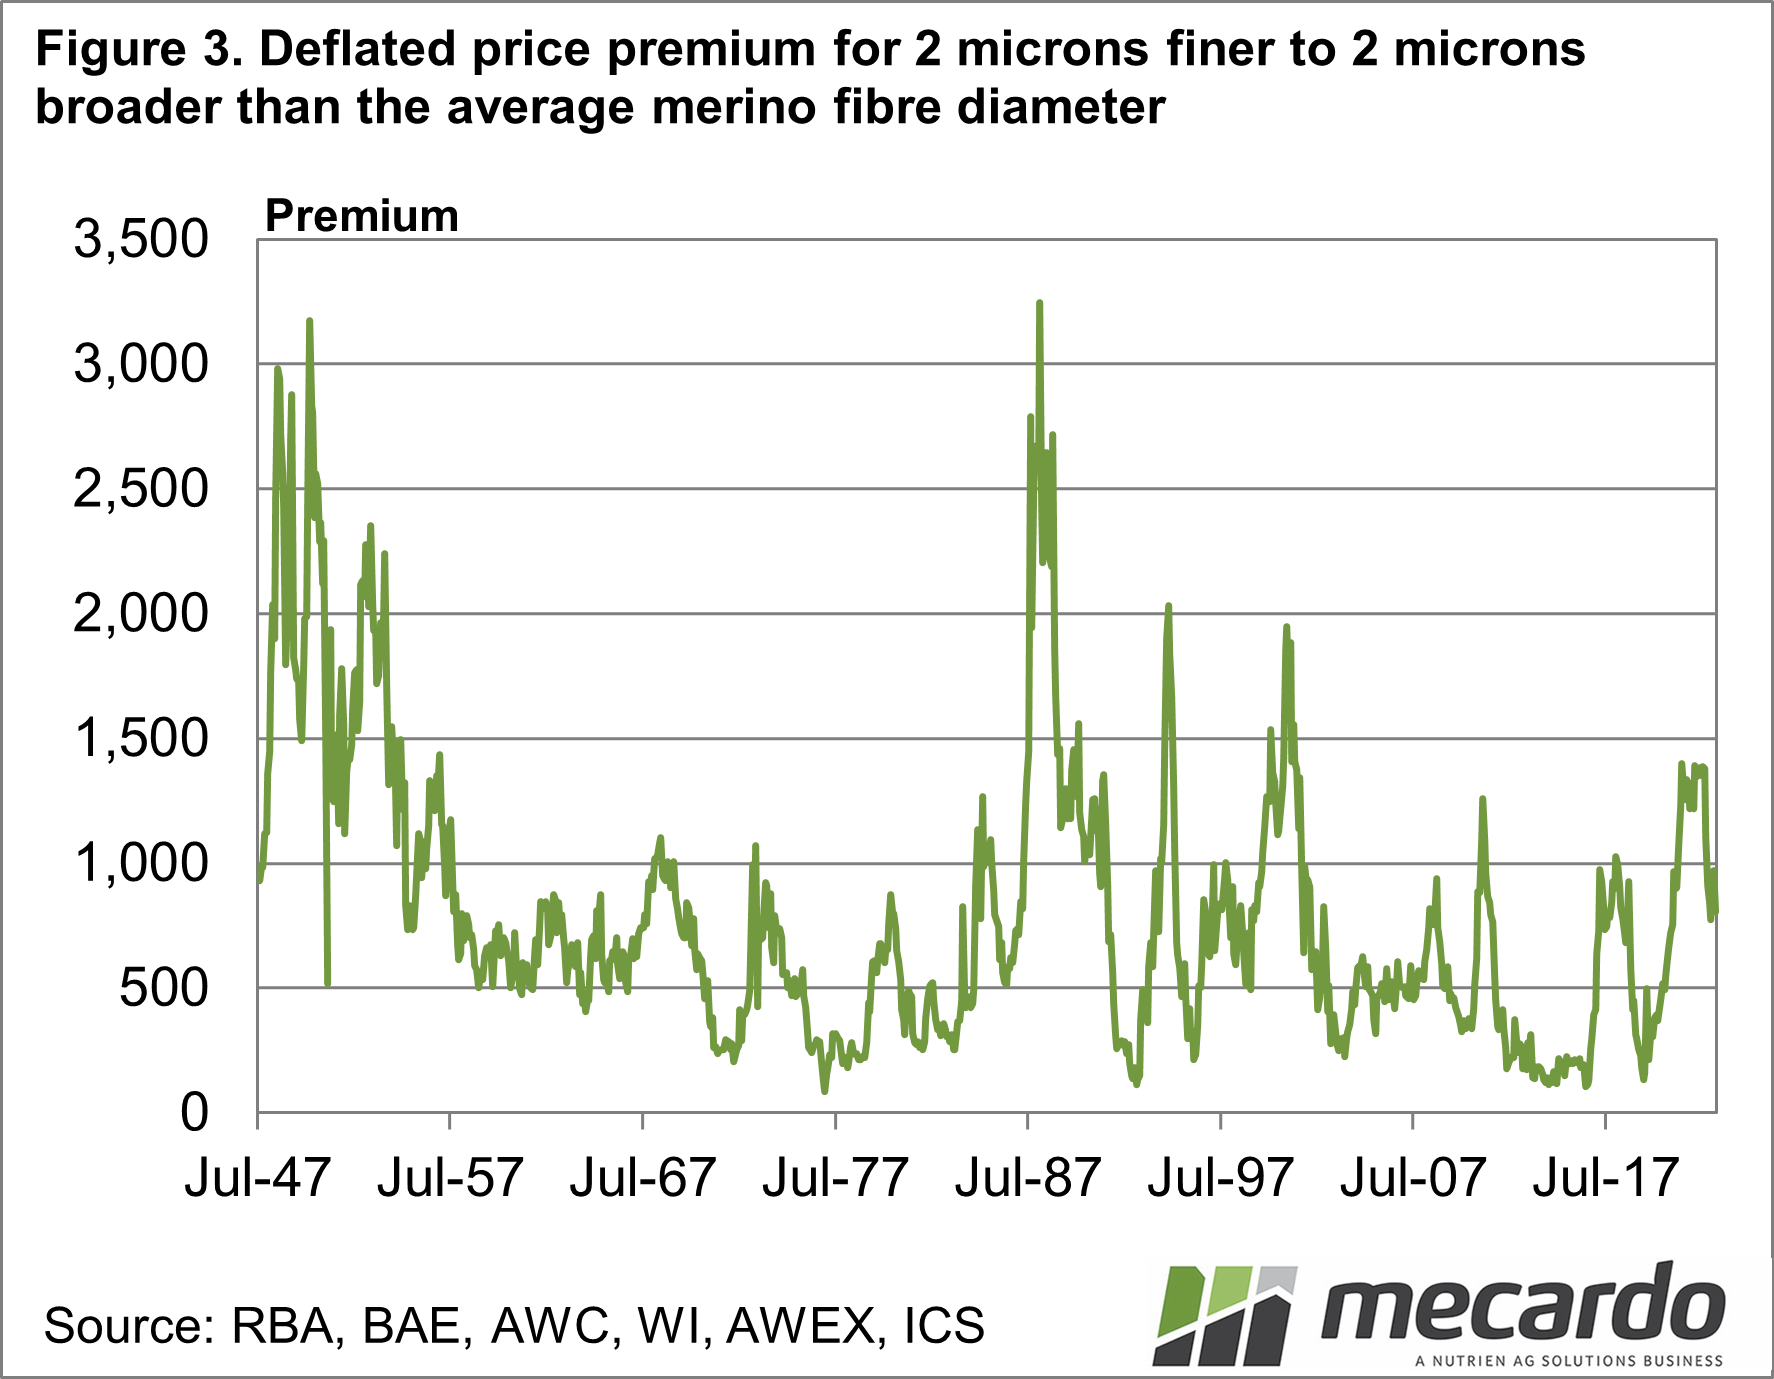
Figure 3 shows the “2-micron broader” and “2-micron finer“ price premium for the same categories as in Figure 1 but in deflated Australian dollar terms. Even by this exacting standard recent premium levels perform well.

What does it mean?
Micron premiums have historically been volatile, and there is no reason to suspect this will change. However, the premiums seen in the market in recent seasons suggest that demand is starting to catch up with the strong increase in supply seen in the two decades from the mid-1990s onwards. Supply seems unlikely to increase in the coming decade as the sheep industry focuses on meat production and larger sheep which is another plus for fine wool.
Have any questions or comments?

Key Points
- Fine micron premiums of the past two years have been strong in relation to historical levels.
- When the supply of fine merino wool, which is ample, is considered the premiums are outstanding.
Click on figure to expand
Click on figure to expand
Click on figure to expand
Data sources: RBA, BAE, AWC, WI, AWEX, ICS, Mecardo