The market reporting in the Australian greasy wool industry is by far and away the best there is for primary wool markets, providing a range of widely available indicators which make the market quite transparent. In February, Mecardo looked at the relationship between the Eastern Market Indicator (EMI) and various merino micron category prices. This article takes a look at the reason why the AWEX EMI should be used sparingly to monitor prices for specific micron categories.
To recap the February article, the AWEX Eastern Market Indicator (EMI) is designed to reflect price level changes for the entire Australian wool clip, with specific details about its composition available here. As such it includes crossbred and cardings as well as merino quotes. The combination of merino and non-merino quotes effectively drags the EMI to the broad edge of the merino micron distribution in terms of pricing.
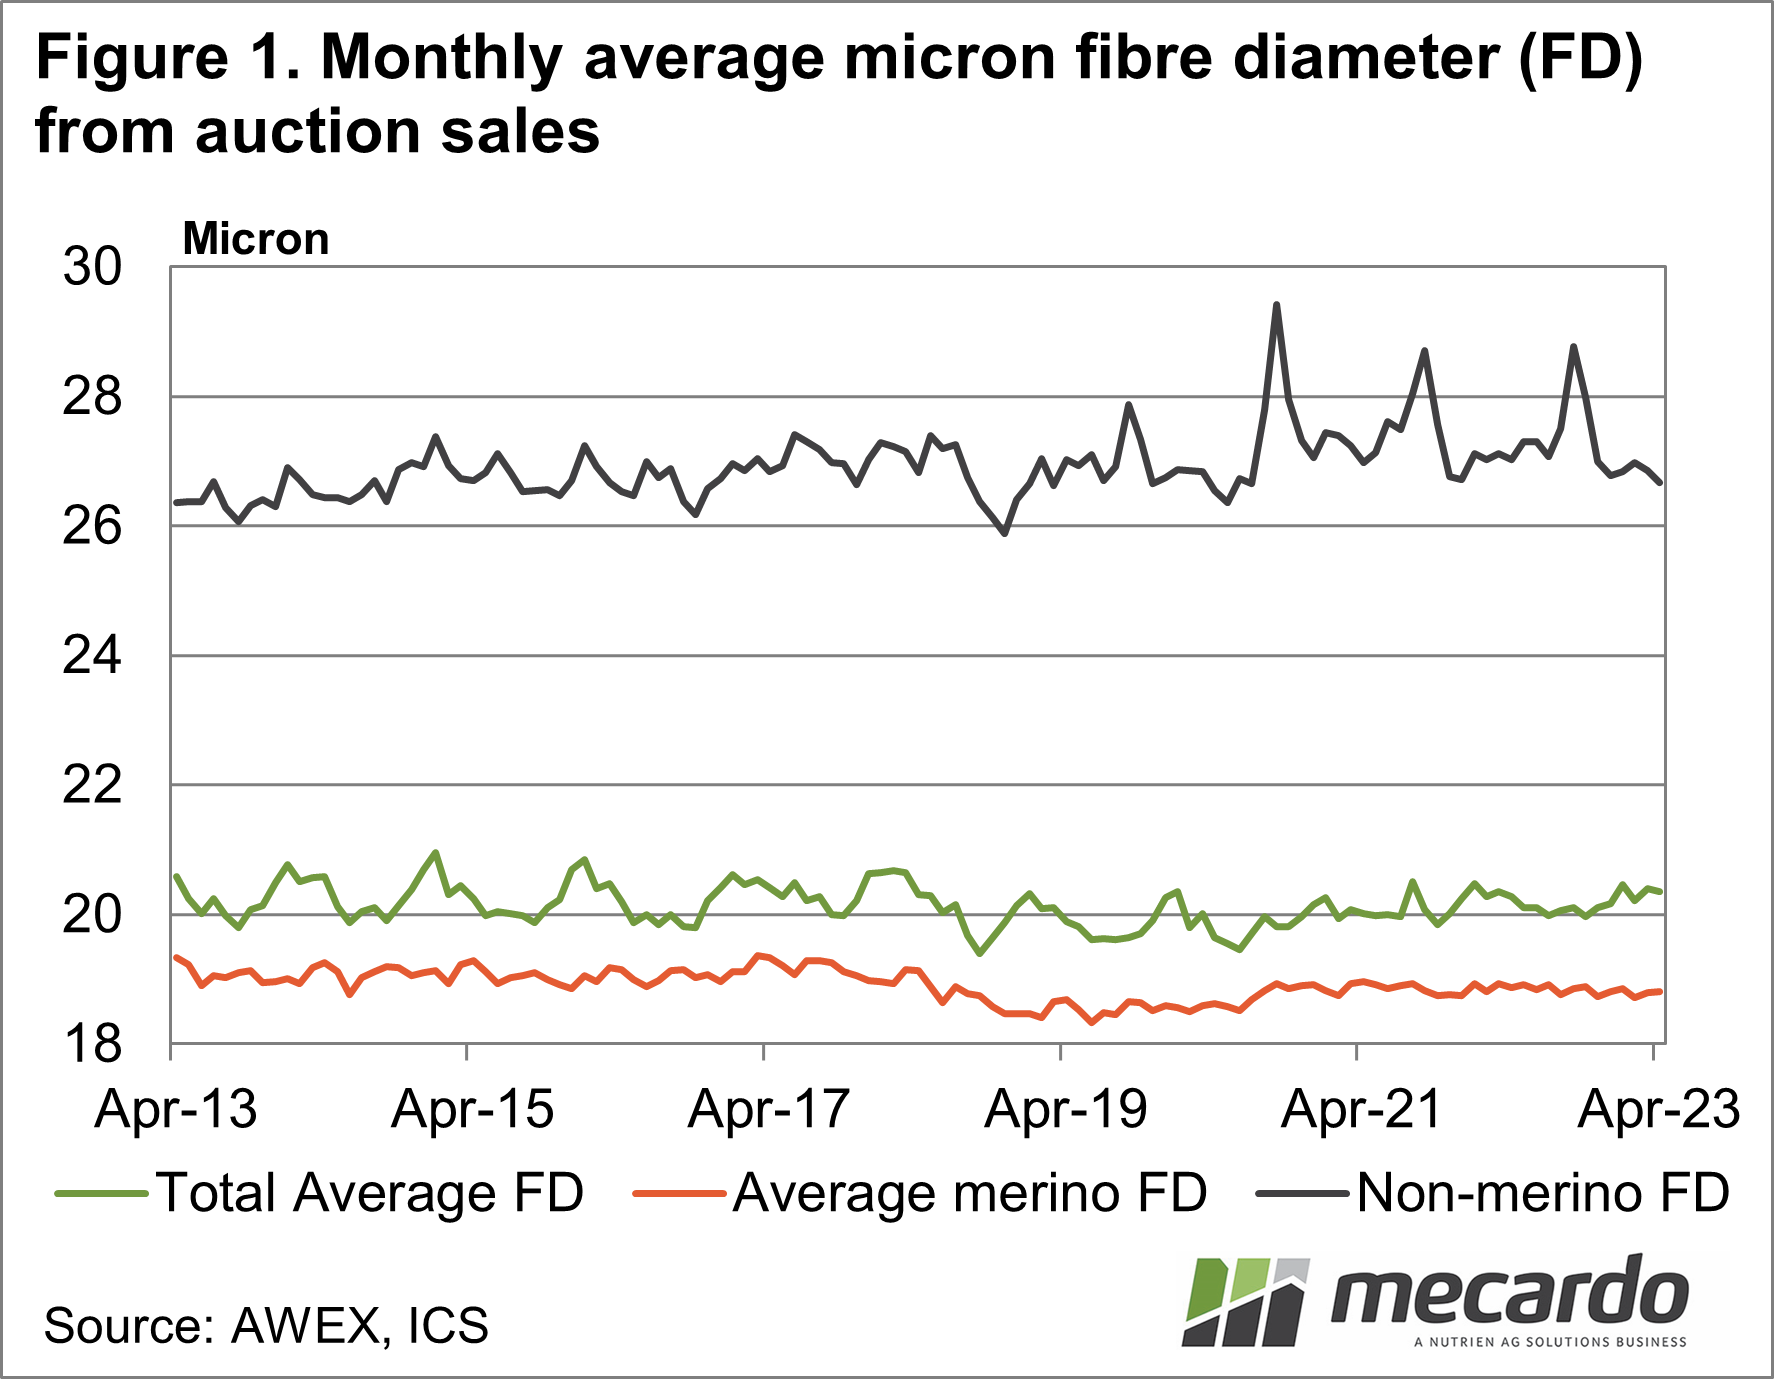
Figure 1 shows the monthly average fibre diameter for all wool sales (at auction), for merino only and non-merino only during the past decade. Where the overall average fibre diameter has hovered in the 20 – 21 micron range, the merino fibre diameter has ranged between 18.5 and 19.5 microns while the non-merino has generally between 26 and 28 microns. The non-merino wool has on average pulled the total average fibre diameter 1.2 microns broader than the merino clip.
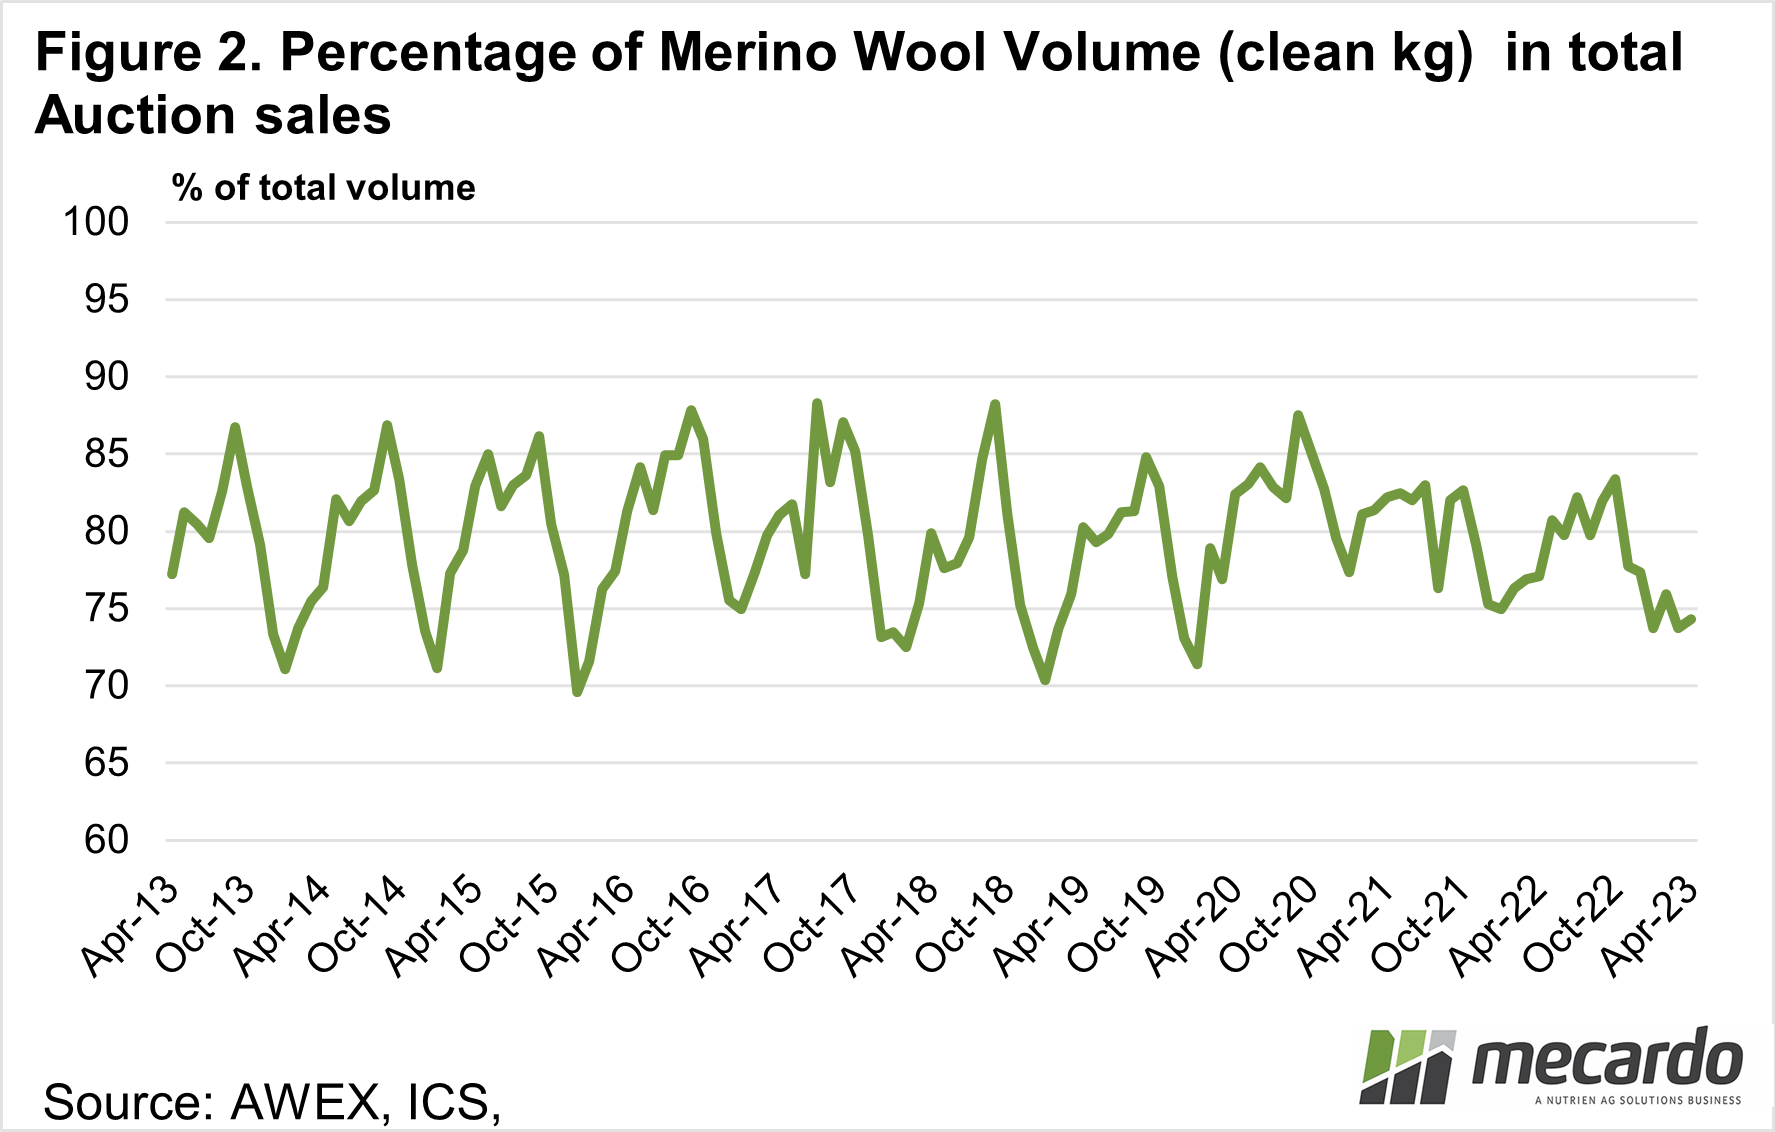
Figure 2 shows a monthly break up of wool sales and what percentage of that is Merino wool (with the balance being non-merino) for the past decade. On average the merino component has been around 80% of auction sales during this period although there is a distinct seasonal pattern to the supply of non-merino which peaks in the March quarter. Any further change in this ratio of merino to non-merino will affect the relationship between the clip average fibre diameter and the merino-only fibre diameter.
The February article showed that the EMI had a strong relationship with the merino micron category which was 2 microns broader than the average (so currently around 21 microns). Even on the broader side of the merino-micron distribution, the EMI can vary by 10-15% in value above and below the 21-micron category.
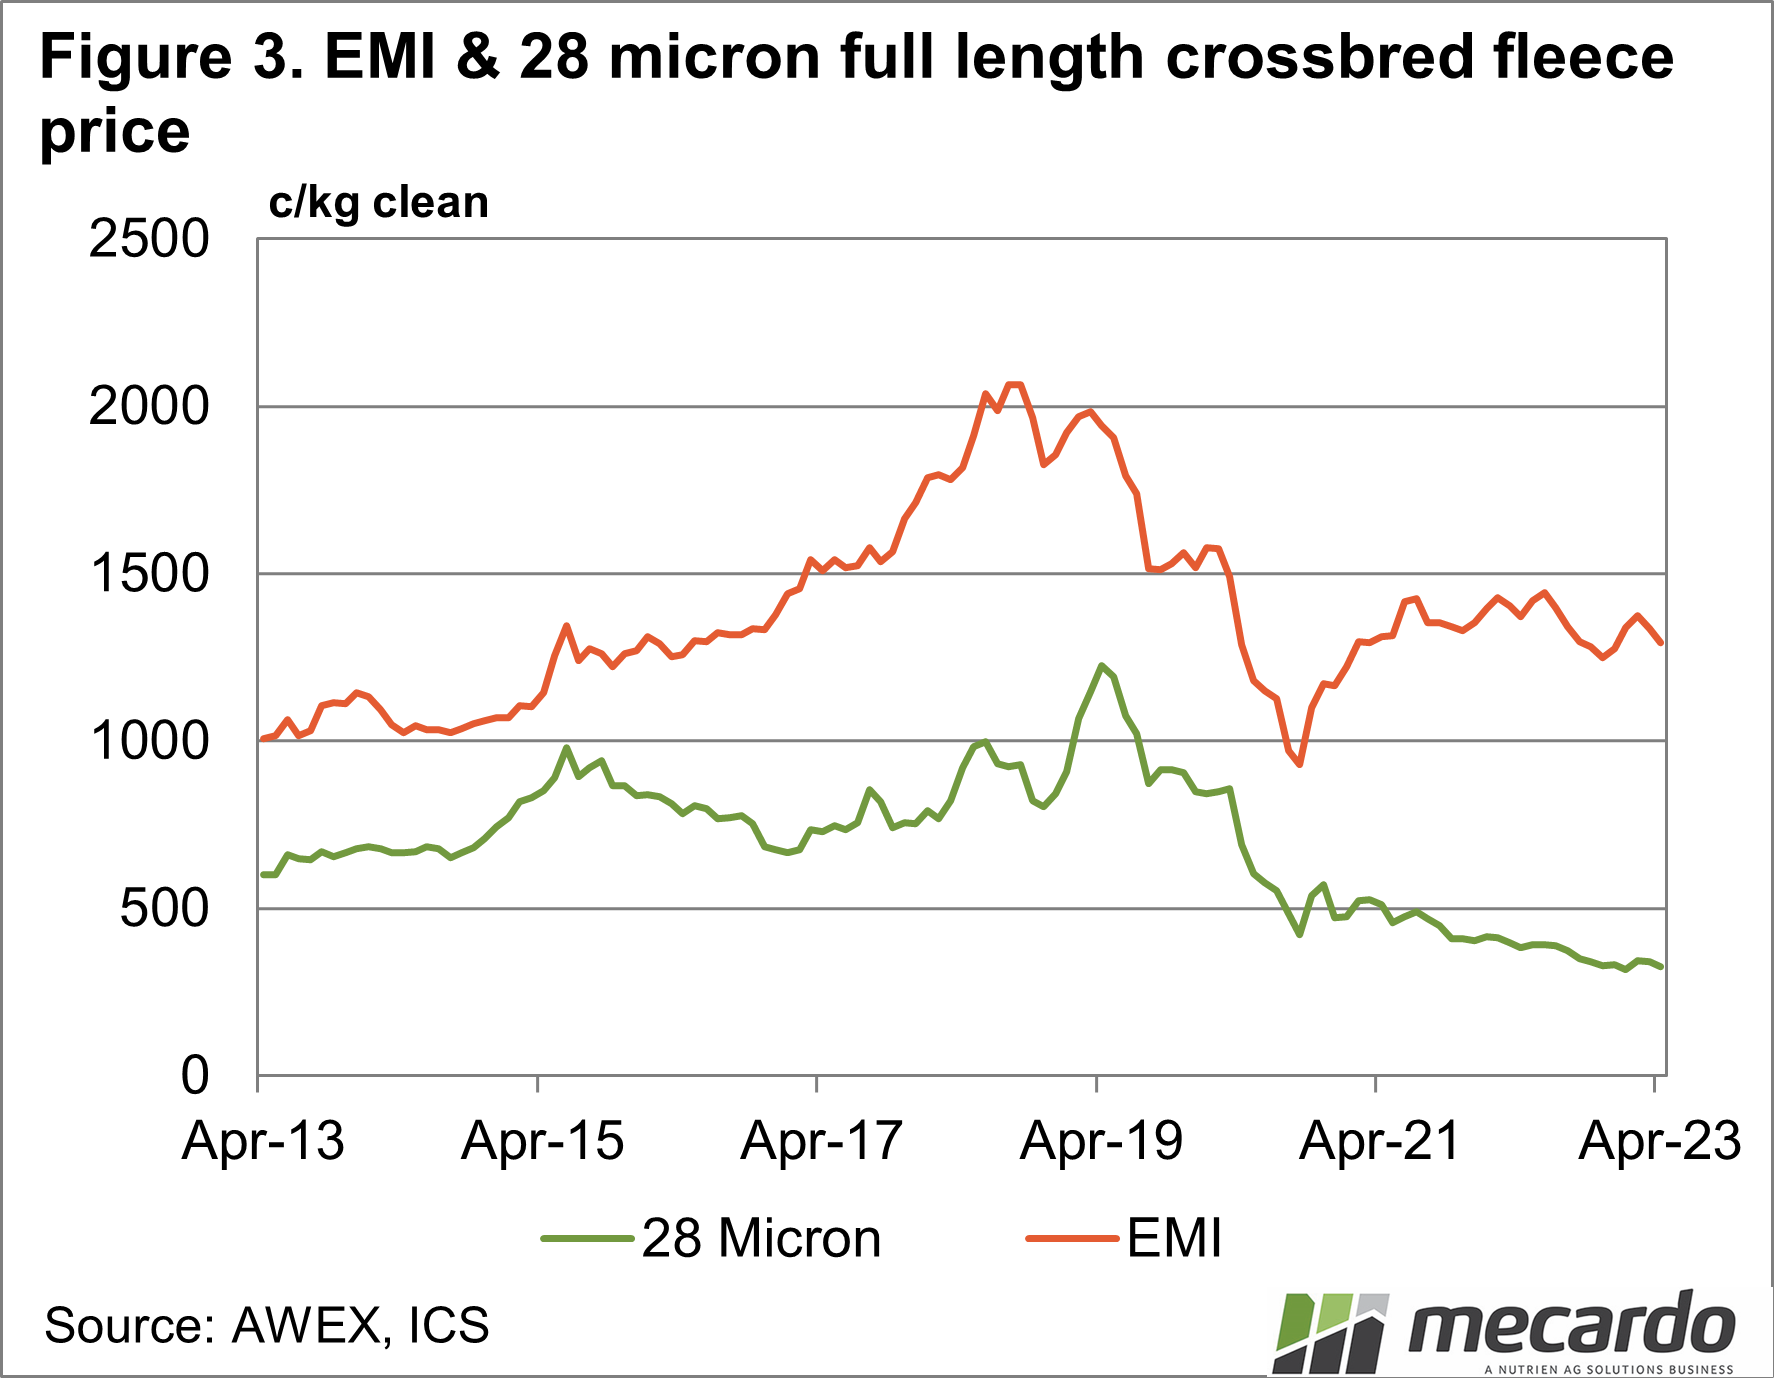
For the non-merino micron categories, the EMI has an even looser relationship. Figure 3 compares the EMI and the average monthly price for 28-micron full-length crossbred fleece, for the past decade. While there are some similarities between the two series, there is enough difference to negate the use of the EMI for monitoring 28-micron crossbred prices.

What does it mean?
The message in this article is the same as it was in the February article. The Australian wool industry is blessed with good, reliable micron price guides (MPG) which are a better tool to monitor market levels than the EMI, which is only a general overarching indicator.
Have any questions or comments?

Key Points
- AWEX does an excellent job in maintaining the transparency of the Australian greasy wool market.
- However there are better (MPG) indicators by which to monitor the greasy wool market than the EMI.
- The merino and non-merino clips are quite distinct in their end-uses so any reporting of the average fibre diameter for the entire clip is misleading.
Click on figure to expand
Click on figure to expand
Click on figure to expand
Data sources: AWEX, ICS, Mecardo