In mid-September, Mecardo looked at previous down cycles in lamb and mutton prices since 1970, showing the current downturn is certainly rhyming with the past. In this article, we look more closely at the rebounds in price seen following such down cycles.
In the earlier article, nominal price data was used as we were looking at changes in price across reasonably short periods of time. For this article inflation-adjusted price data (deflated) has been used simply to eliminate as much variance in the price as possible. In practical terms, the use of deflated data did not turn out to change the median structure of price downturns by much. Also, it should be noted that monthly average prices are used, which takes some of the variability out of the data, especially in recent weeks.
The earlier article noted that price tended to rebound a proportion of the down cycle fall quickly, and it is these rebounds the article focuses on. Astute readers will realise there is one problem with the timing of this article, that is we are yet to identify the bottom of this current cycle. History points to this happening in the period from October through January, so in terms of time, we are likely to be close to the base. For the purpose of the article September average prices are taken as the base price, in order to calculate possible rebound levels.
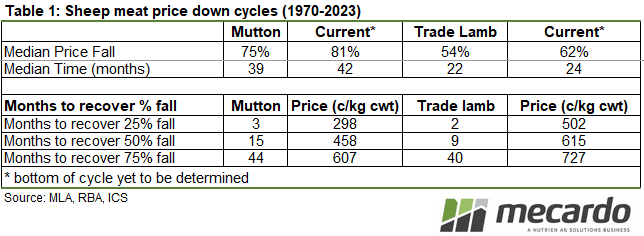
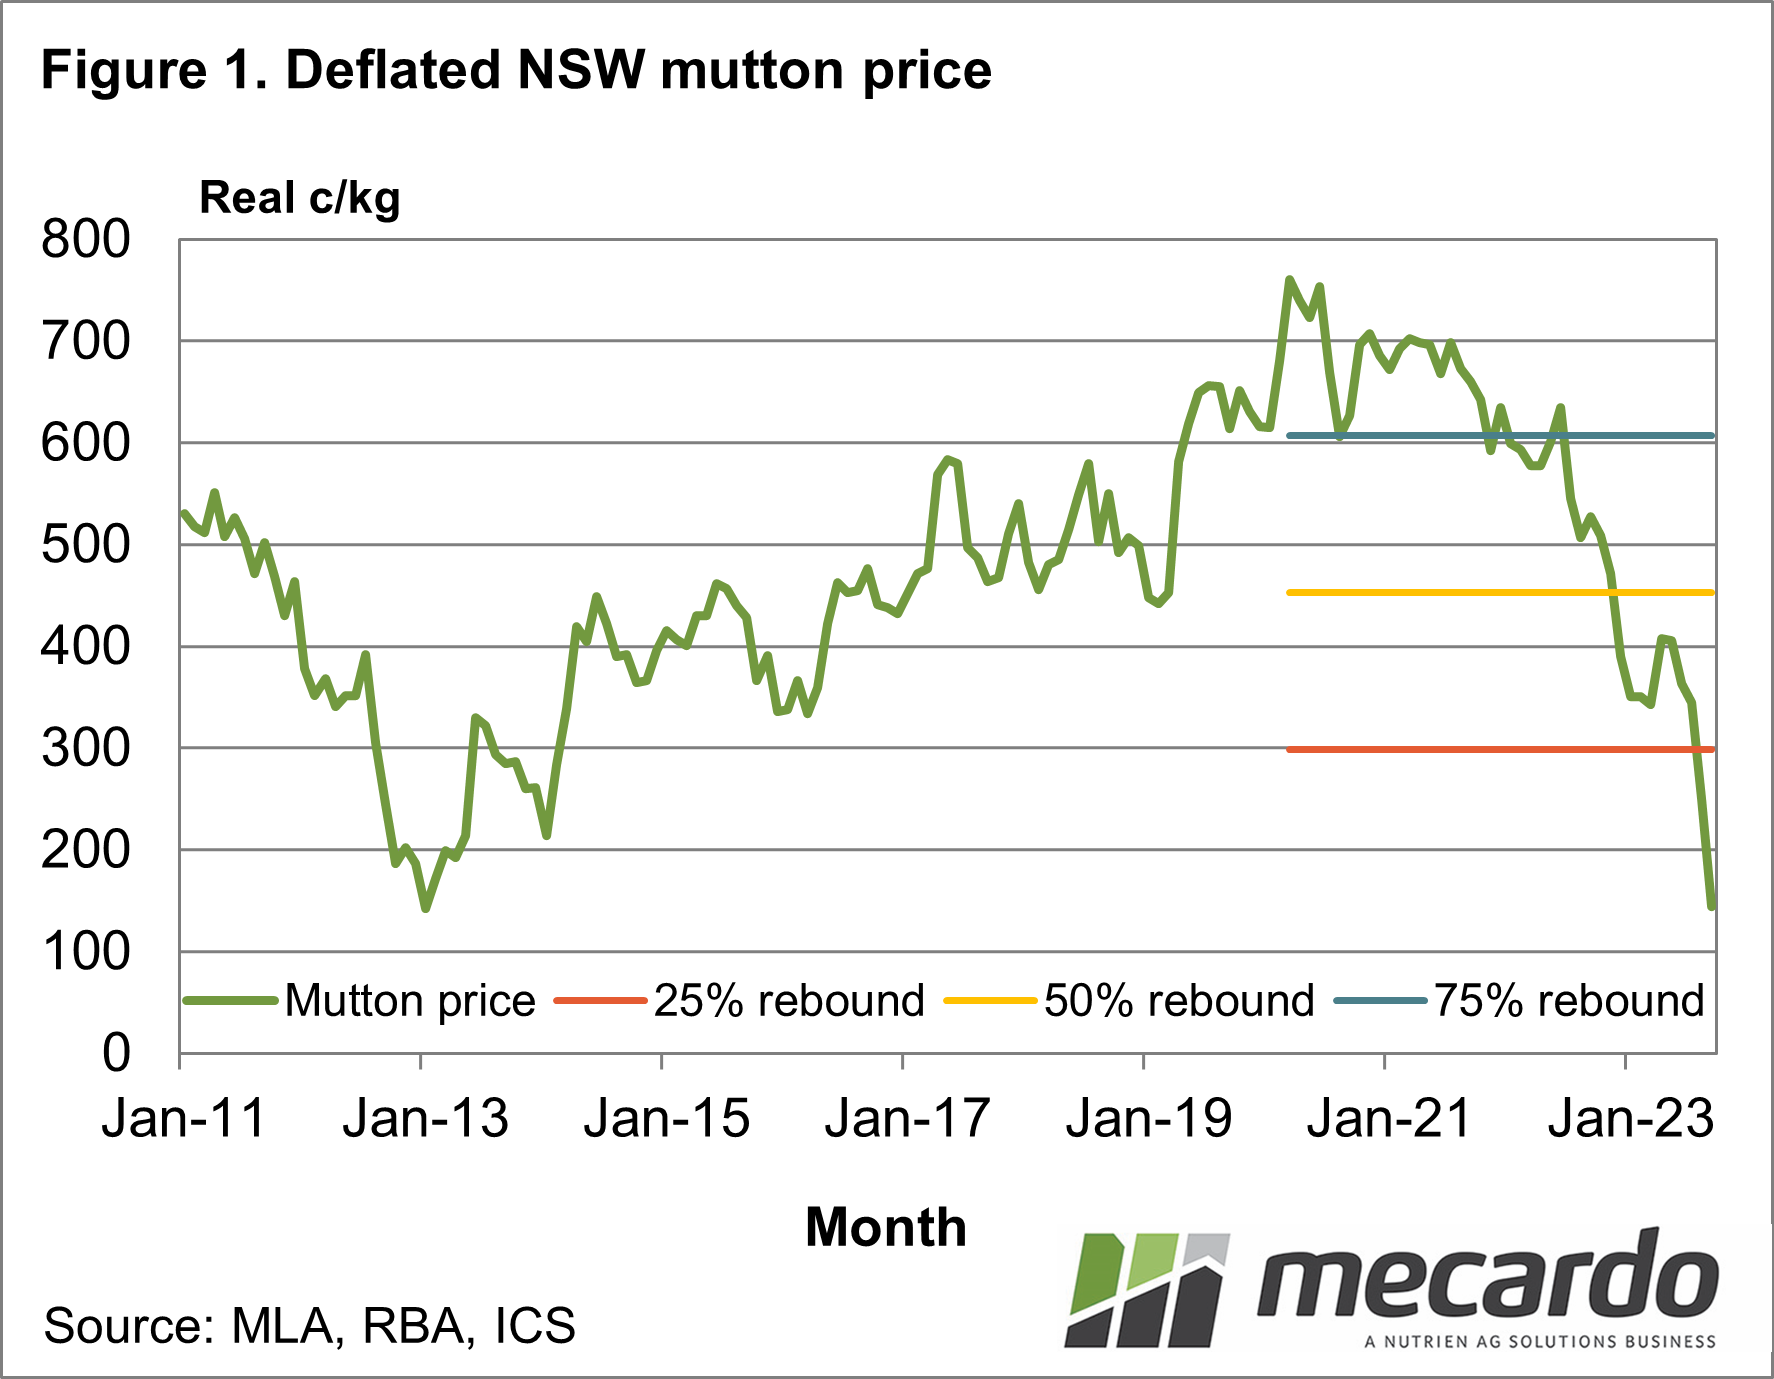
Figure 1 shows a NSW saleyard mutton price series, adjusted for inflation, from early 2011 to September 2023. In the methodology used, the recent peak price occurred in March 2020, with the mutton price falling 81% since then. Table 1 shows the median price fall and time taken for down cycles since 1970, plus the time taken to regain 25%, 50%, and 75% of the preceding fall. The current down cycle in mutton is close to the median historical pattern. Not much can be done about that but for planning in 2024 the rebound pattern may be of some use. Using the assumption highlighted above that the September average is the low for the cycle it has generally taken only 3 months to recover one quarter of the fall which would take mutton back to 298 cents and some 15 months to regain half the fall, yielding a price of 458 cents. These levels are shown in Figure 1.
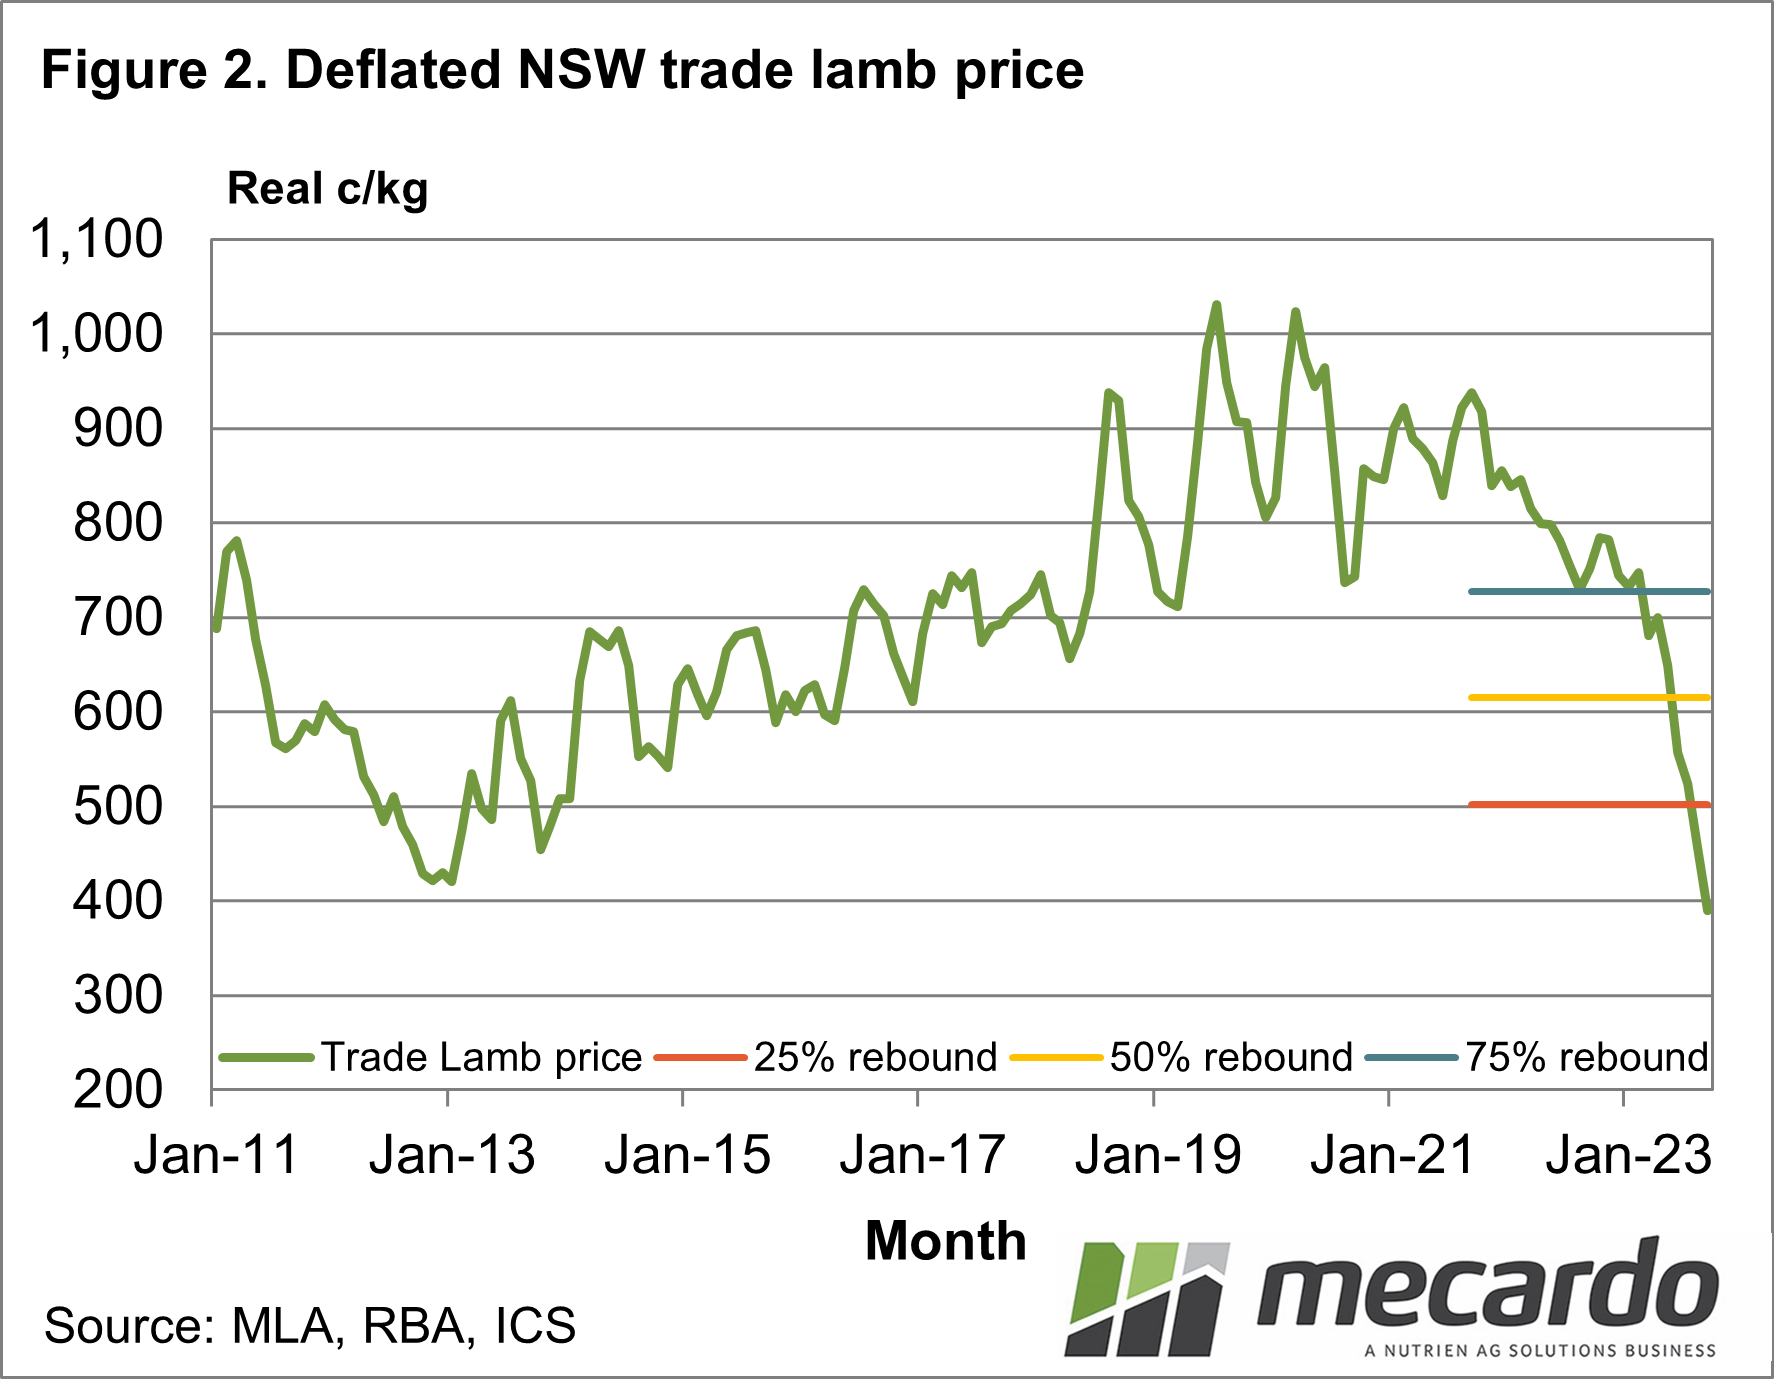
Figure 2 uses the same methodology for a NSW trade lamb price series. The only difference is that the recent cyclical peak is set at September 2021. As shown in Table 1 the current downturn is close to the median historical pattern for lamb prices. The time taken for price rebounds is quicker, two months for the first quarter and nine months to recover half of the fall. These rebound levels are shown in Figure 2.

What does it mean?
As an understatement, current sheep meat prices are providing a challenge for budgets. However, history shows that prices overshoot on the low side in these downturns, hence the relatively quick regain of one-quarter to one-half of the fall in price. When looking into 2024 these rebound estimates (not forgetting to allow time for the rebound to happen) are a more reasonable guess at where prices will be, because it is based on historical patterns rather than using a simple naïve forecast.
Have any questions or comments?

Key Points
- Once a cyclical base is made in the lamb and mutton prices, they very quickly recover one-quarter of the cyclical downturn.
- Lamb then further recovers another quarter of the downturn within 9 months of the cyclical low, with mutton taking longer.
- The estimated price rebounds shown in this article are provisional only as we are yet to confirm the bottom prices in this cycle for mutton and lamb.
Click on figure to expand
Click on figure to expand
Click on figure to expand
Data sources: MLA, RBA, ICS, Mecardo,