The USDA released its acreage report yesterday, into an environment where industry expectations were that US farmers had planted one of the largest areas of corn of the past five years. However, the report showed numbers that were divergent from the general trade consensus, and the result was that the US corn futures rallied, hitting their daily increase limit.
The USDA acreage report delivered estimates for the area of corn planted in the USA that surprised the market yesterday, causing a strong rally in corn prices. Estimated planted corn acreage came in at 92.7 million acres. While this was up 2% or 1.9 million acres from the 2020 crop, the market expectation was more bearish, with recent Reuters surveys pitching the analyst consensus at 93.8 million acres. This estimate overshot the official government estimates by 1.1 million acres or 1%.
A 1% differential in acreage doesn’t sound like much, but when corn yields in the US are estimated to be 180bushels/acre (4.57ton/acre) for the 2021/22 crop as reported in the June WASDE, the change in area planted equates to in excess of 195 million bushels (5mmt) less for the season. Add this to the fact that US corn stocks are the lowest since 2014, and the seasonal conditions in some key cropping states is yet to deliver, you have a recipe for some serious price volatility.
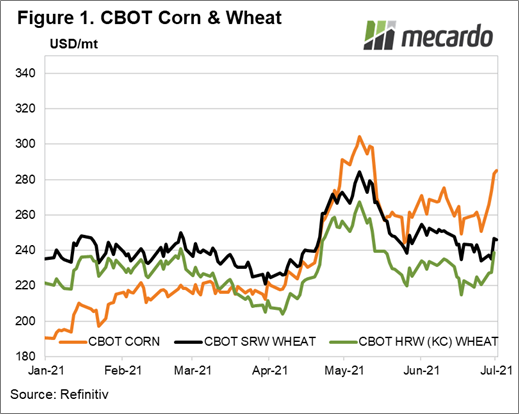
The result was that nearby US Corn futures skyrocketed 7% (figure 1) after the news came out yesterday, reaching an intraday peak of $US7.43/bus ($US292/mt) where it hit the circuit breaker daily upside limit of 40cents/bushel. It then retreated back to US$7.20/bu ($US283.44/mt) by close. Wheat followed the leader with CBOT SRW wheat advancing by close of market by 5% or $US0.32US/bu ($US11.66/mt)to $US671.5/bu ($US246.73/mt).
The condition of the US corn crop is also currently tracking below average, but is far from the worst that has been seen over the past 20 years (i.e. 2012). There is still plenty of room for yield estimate downgrades from here though, and hence lower overall production. The crop is currently entering the silking phase of development, which is one of the most crucial stages from where it is most sensitive to nutrient or water stress impacting yield.
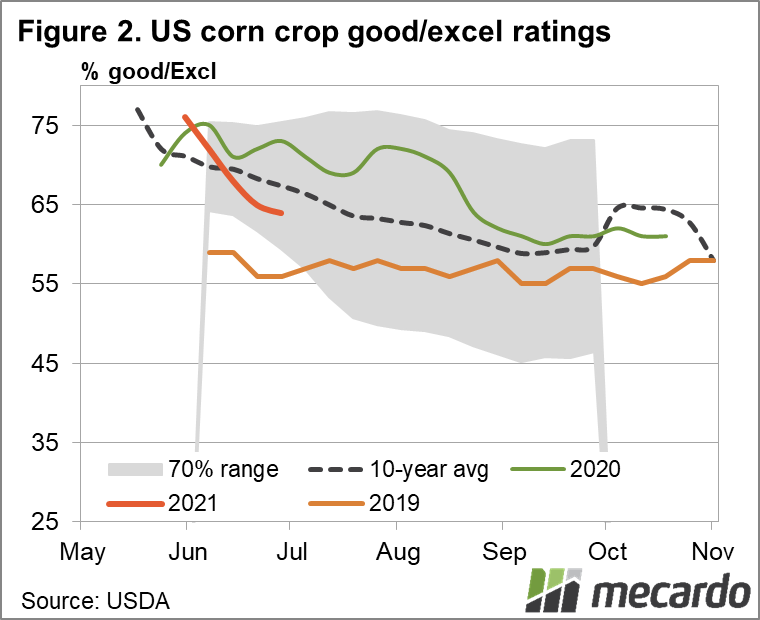
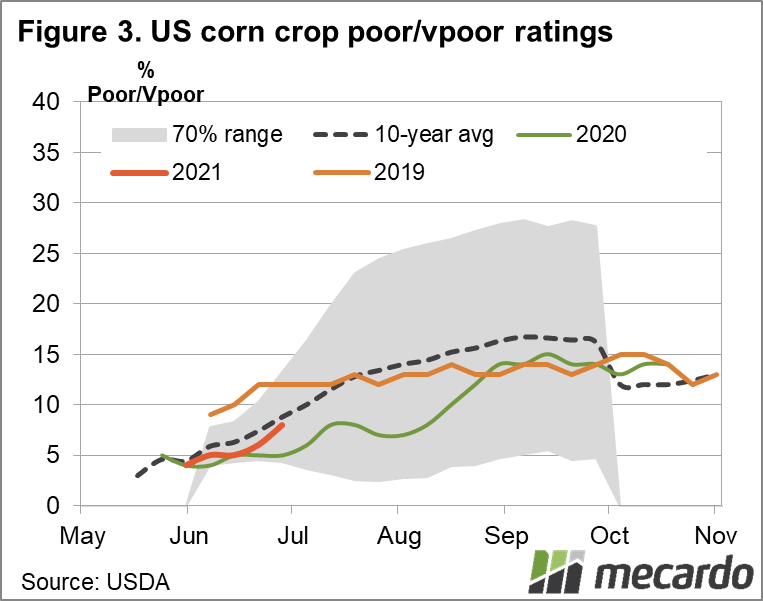
The latest data indicates that corn condition is rated at 64% Good/Excellent, (figure 2) which is 3% below average, and 9% below 2020’s crop rating of 73% at the same time of year. At the other end of the spectrum, the poor/very poor rating sits at 8%; which is 3% worse than 2020, and 1% better than the 10 year average (figure 3).
By harvest time in November 2020, the good/excellent rating worsened to 61%, and the poor/very poor rating blew out to 14%. Final 2020 yields sat at 172bu/acre (4.37ton/acre).
To put this into perspective though, the worst year for US corn in the last decade was 2012, when 50% of the crop was considered in poor/very poor condition, and only 25% rated good to excellent by harvest time. Yields were at 123 bus/acre (3.12ton/acre), which is 21% less than the average of 156bus/acre (3.96ton/acre) in the 20 years since the turn of the millennium.

What does it mean?
US corn prices have seen substantial volatility in recent times, the relevance for Australia is that when world corn prices become more expensive, wheat tends to be dragged up in its wake because it is part of the global feedgrain complex. A lower than expected acreage of planted corn, coupled with below-average crop conditions, and risk for further deterioration suggests that total expected corn production could go lower, and price higher as the market closely watches for adverse weather developments in the next couple weeks, which is good news for wheat.
Have any questions or comments?

Key Points
- US corn & soy acreage report lower than expected
- US Corn crop condition ratings are below average and history shows it tends to deteriorate over time; weather risks abound.
- Wheat prices have followed corn upwards to $US246/mt
Click on figure to expand
Click on figure to expand
Click on figure to expand
Data sources: USDA, Reuters, Refinitiv, Mecardo