With uncertainty about the size of the Western Australian sheep flock and the consequent wool clip due to drought and live export policy, Mecardo thought it timely to look at the contribution of the Western Australian wool clip to the national clip.
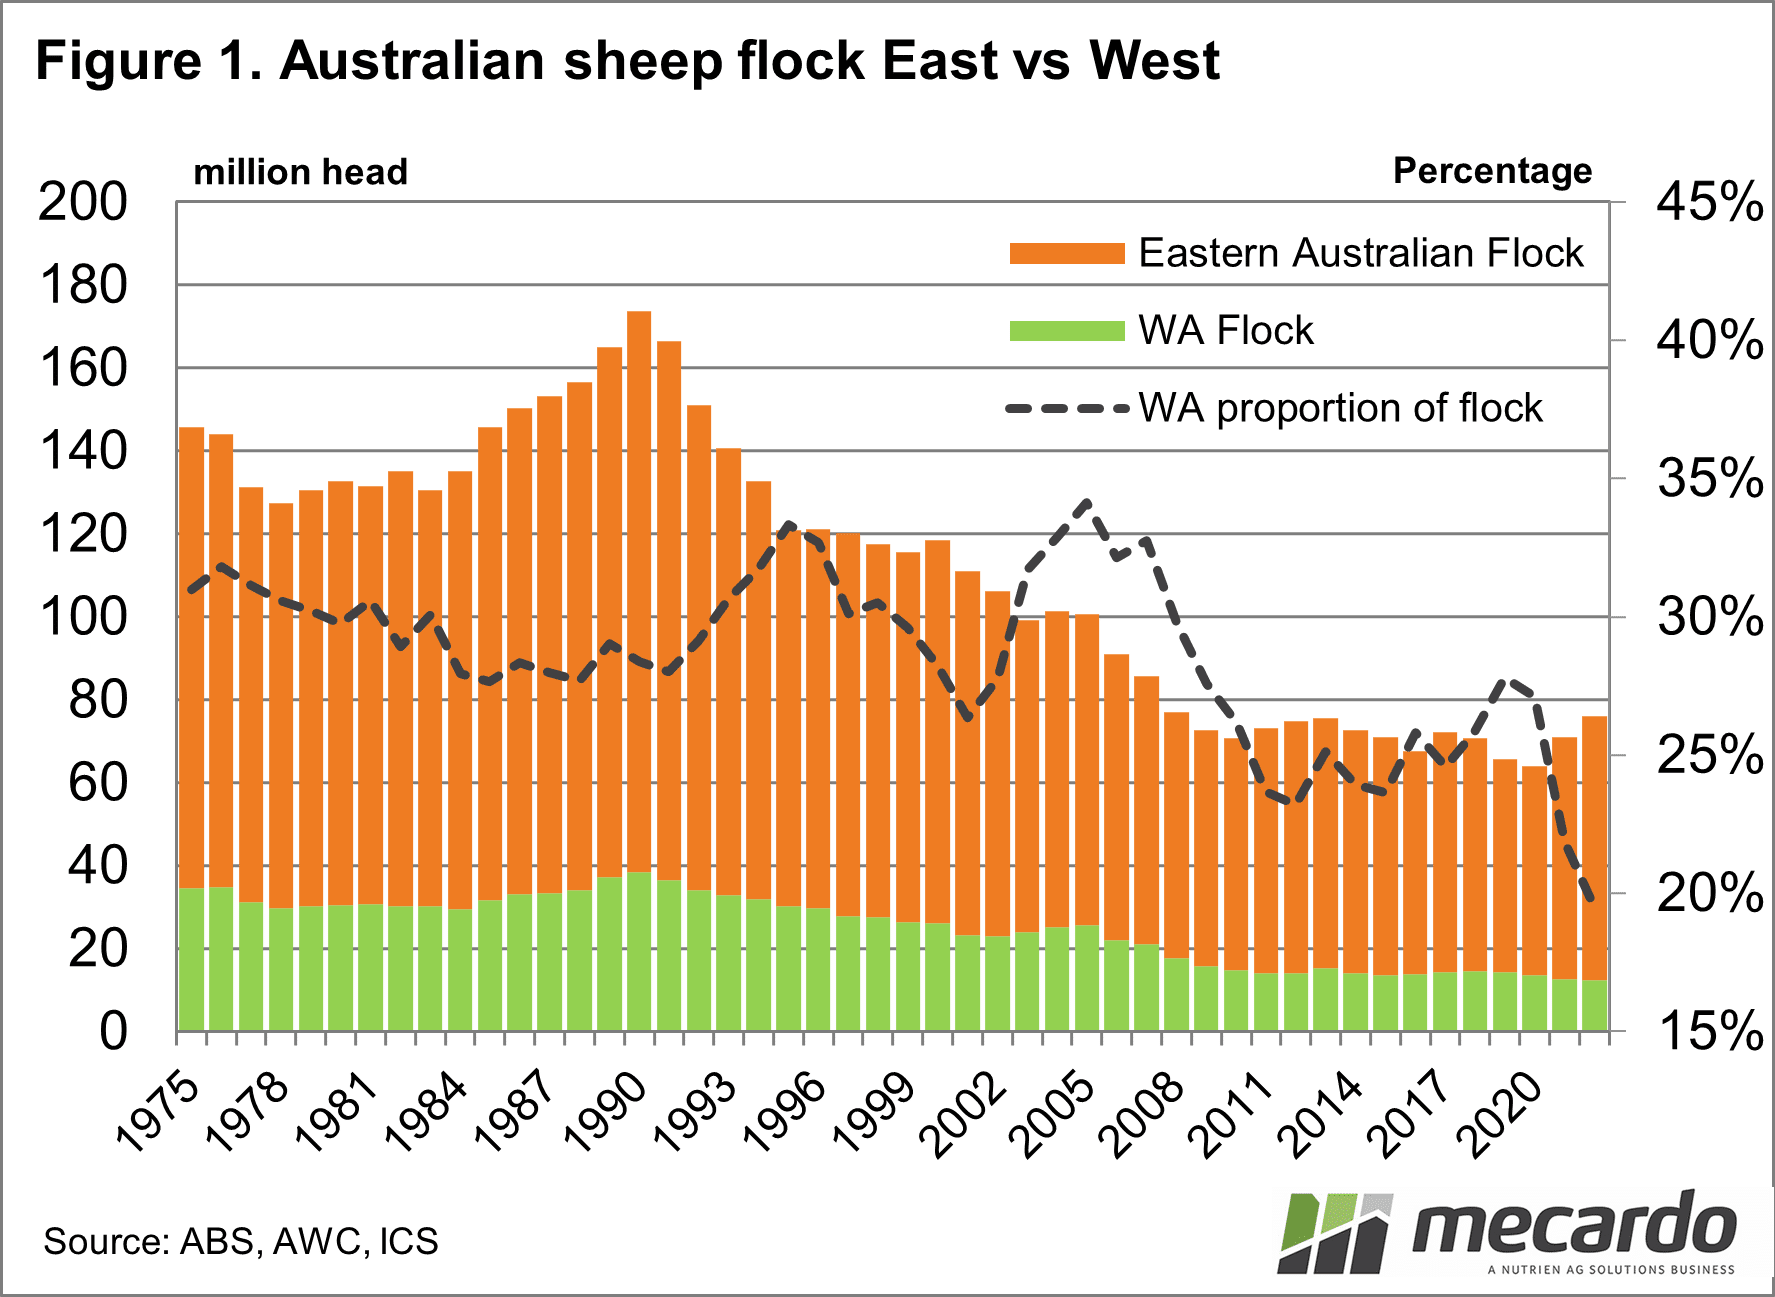
Sheep numbers in Western Australia have followed a similar
trend to Eastern Australia and other merino wool-producing regions in the
southern hemisphere in recent decades. Figure 1 shows the Australian flock
split into the western and eastern components from the mid-1970s until 2022
(the latest survey estimate) with the proportion taken up by the western flock
shown in the right-hand axis. In the decades to 2010, the western proportion
varied between 27% and 34%. After 2010 the proportion settled into a range
between 23% and 28%. A combination of a recovery in the eastern flock following
the 2017-2019 drought and a shrinking in the western flock saw the 2022
proportion fall to 19%.
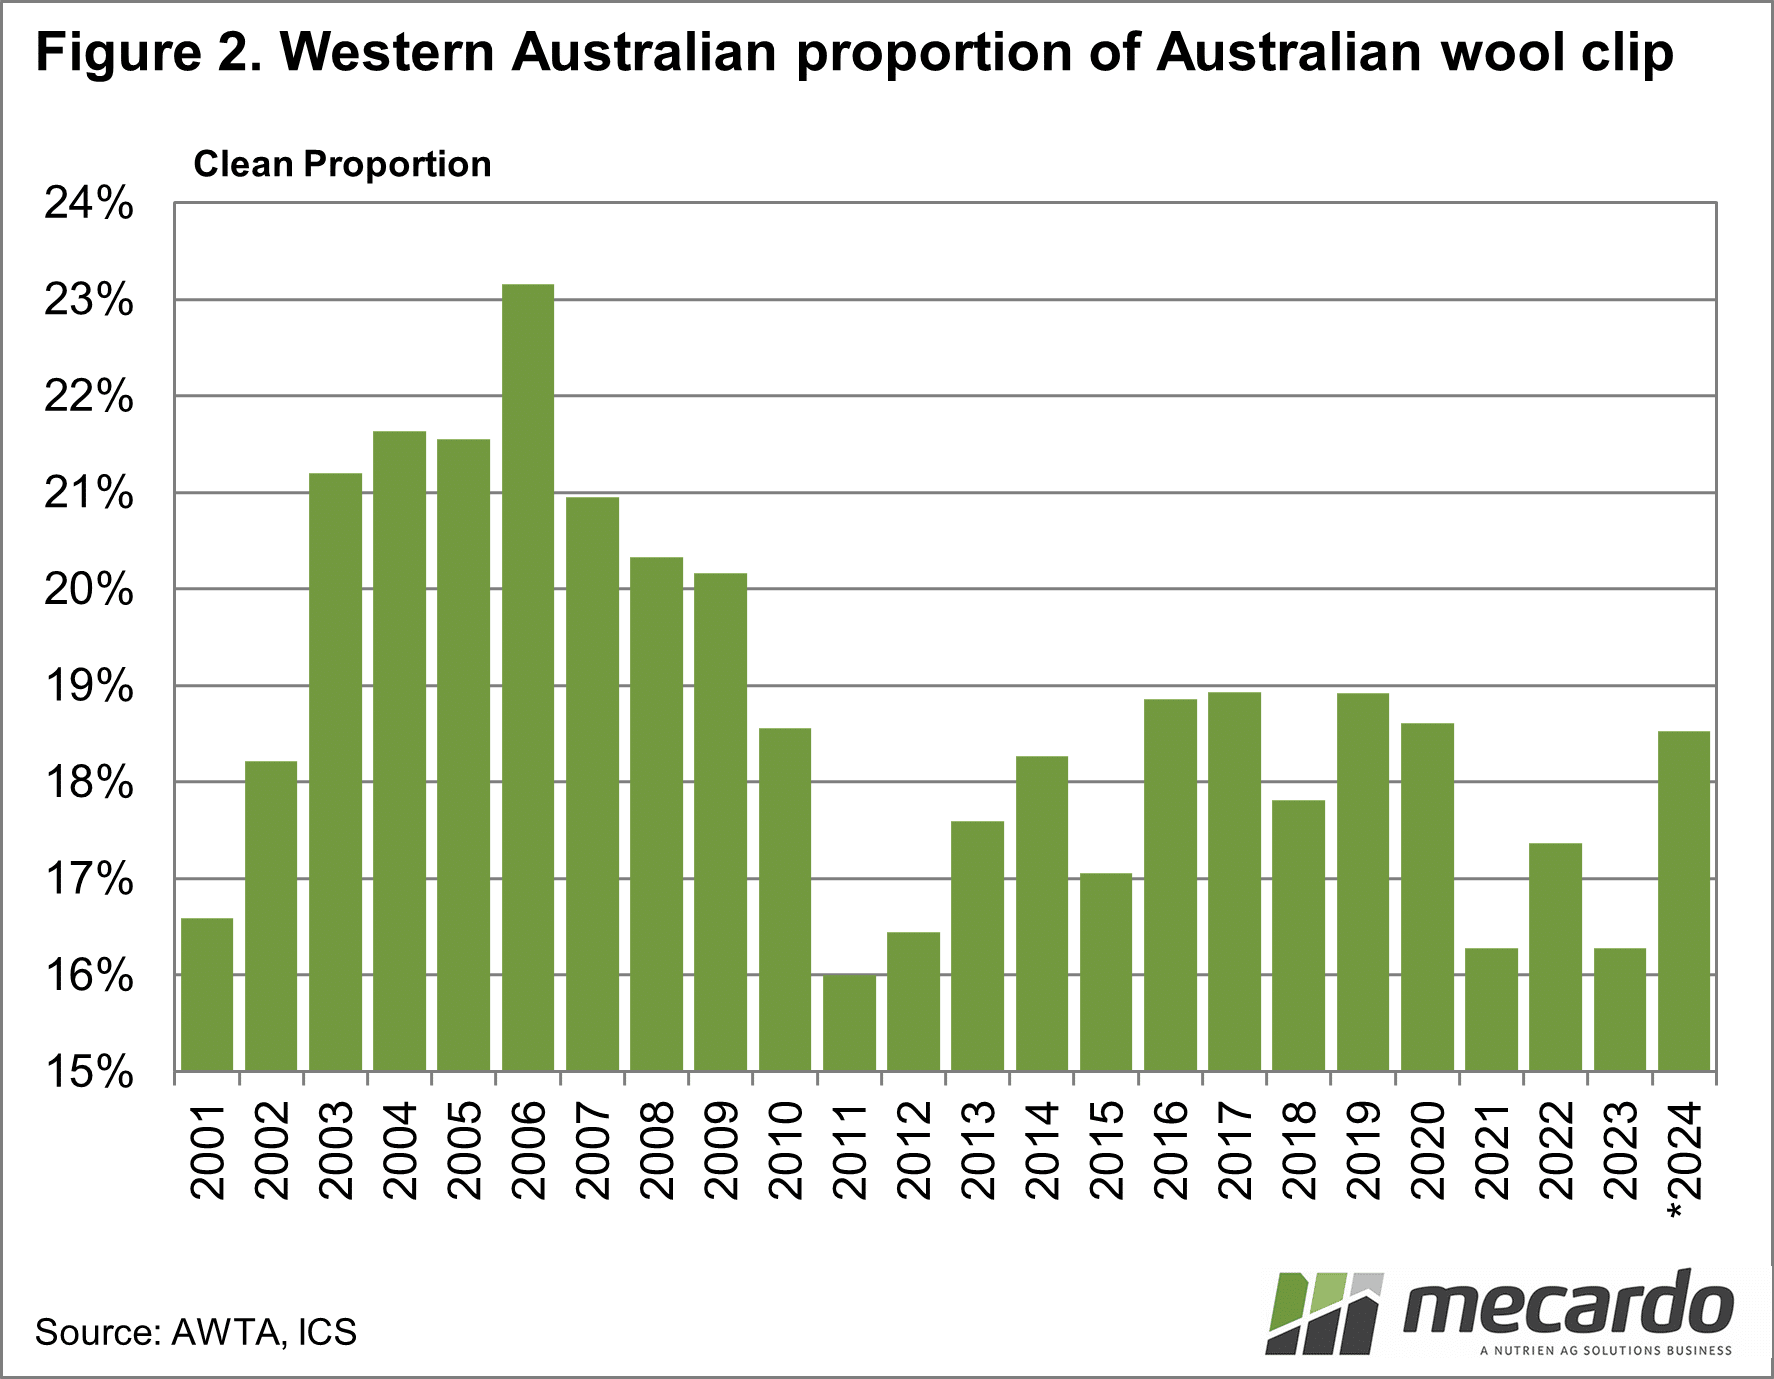
Figure 2 uses AWTA volume data to show the season-annual
proportion of the Australian wool clip accounted for by Western Australian
production from 2001 onwards. Western Australian wool growers tend to be more
aggressive in stock holding of greasy wool so production for a season does not
always translate into sales for that season. This stock-holding effect also
impacts AWTA volumes, as not all wool is tested close to shearing times, as it
may be stored untested. With this caveat in mind, the AWTA proportions are
broadly in line with the flock proportion. From 2003 to 2009 WA wool accounted
for 20-23% of total volume. Since 2009 the proportion has been a lower range of
16-19%. If you are a processing mill wondering what a change in Western
Australian sheep numbers will mean for wool production in Australia, basically
a 10% change in the western flock will translate into a 1.5-2% change in the
Australian wool clip on a clean basis.
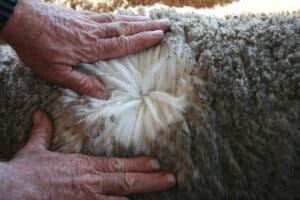
When it comes to wool production, the micron profile of the
Western Australian clip is more like the South African merino clip than the Eastern
Australian clip. This means that changes in the western clip production will
have unequal effects across micron categories.
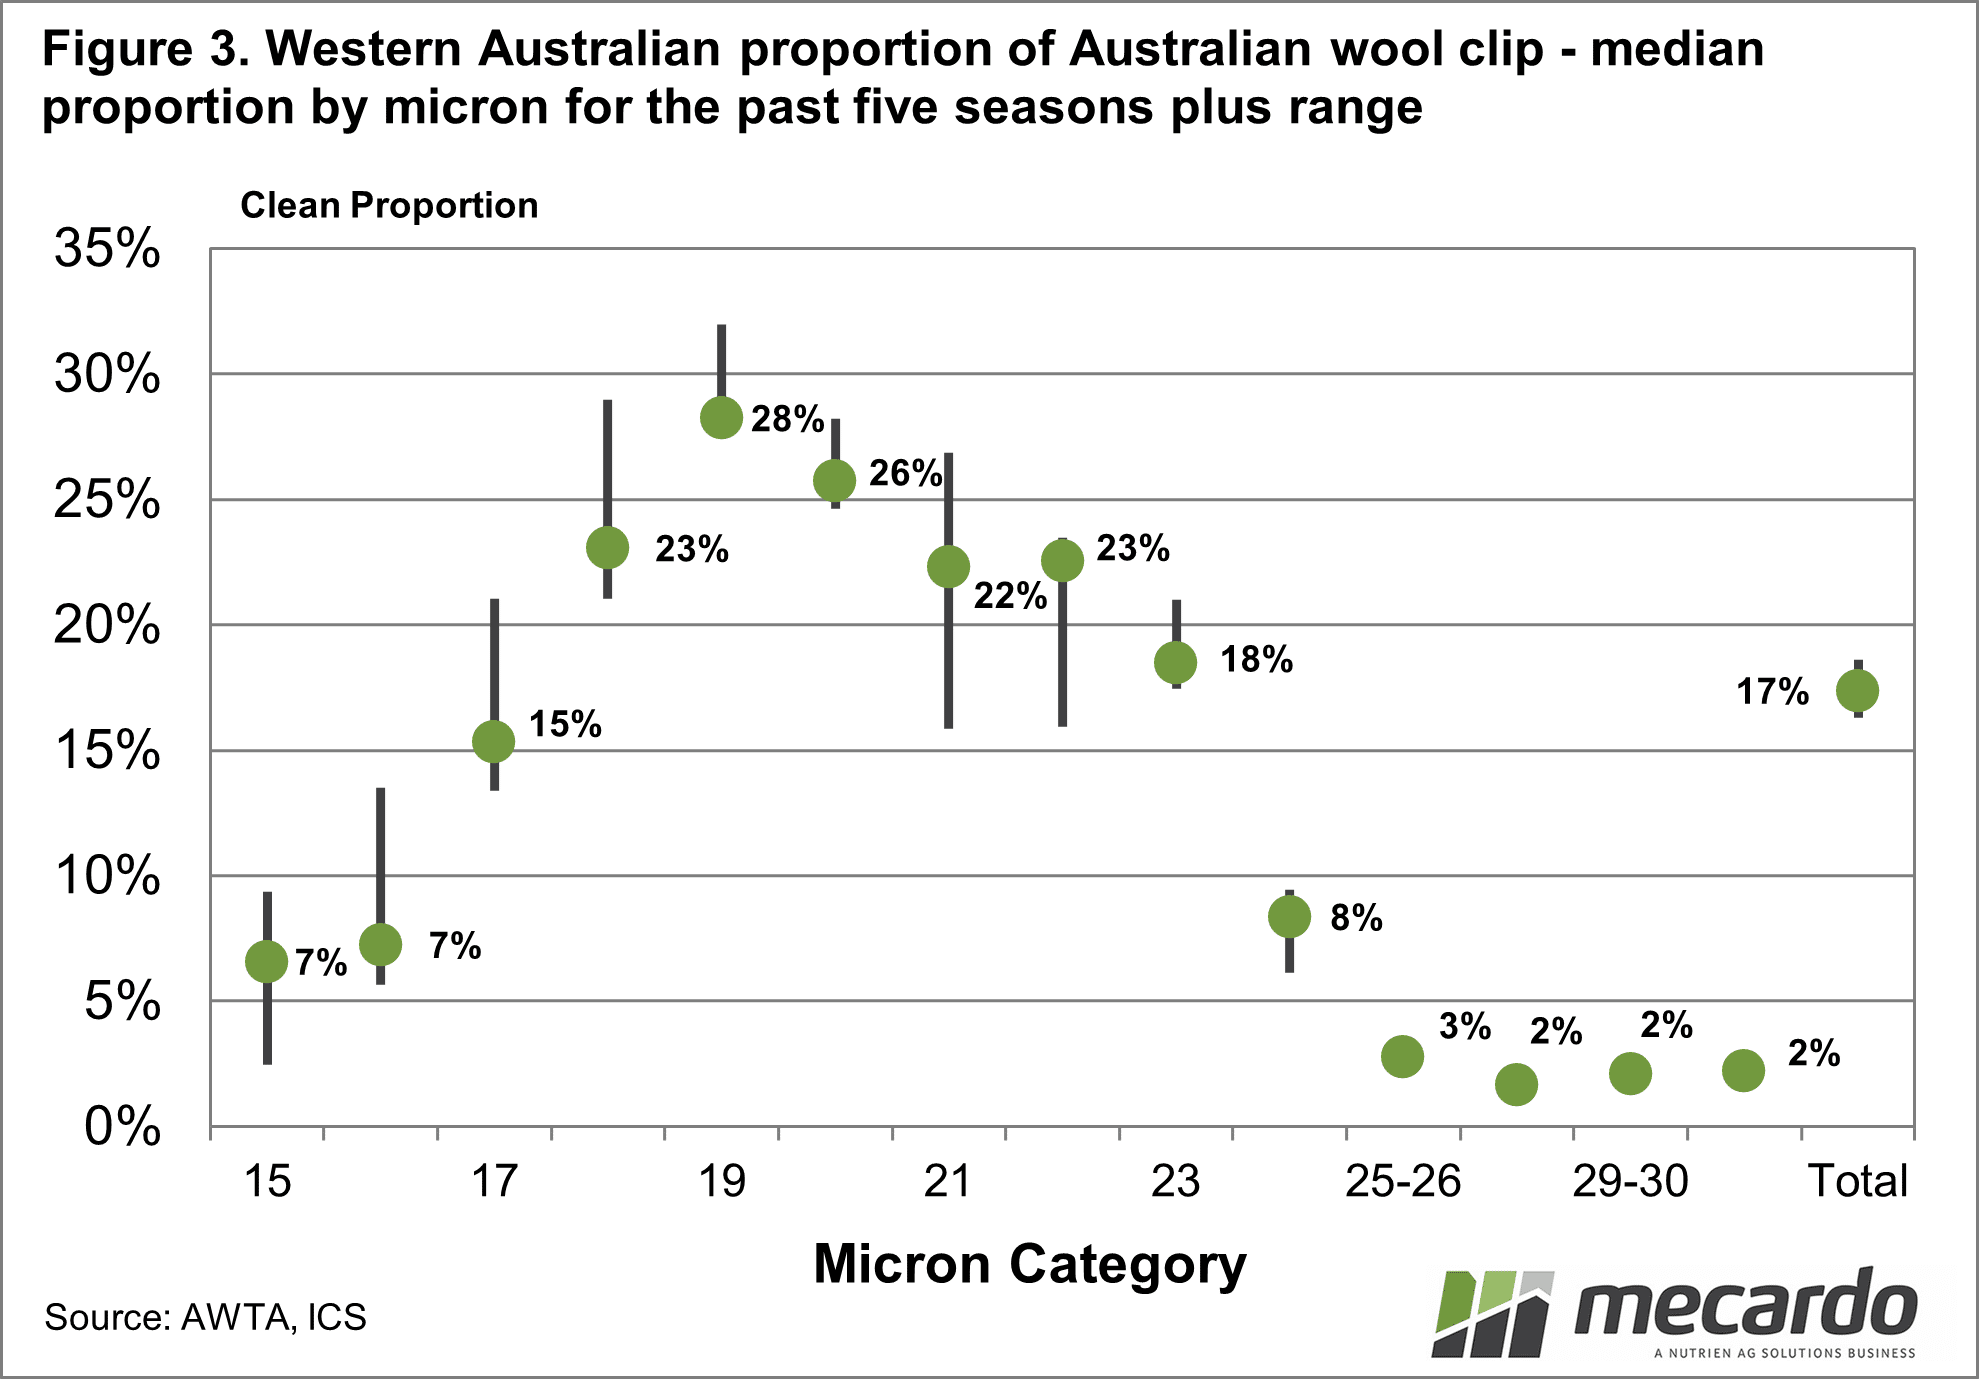
Figure 3 shows the median proportion of Western Australian
AWTA core test volumes (clean basis) for the past five seasons by micron
grouping, along with the range of annual proportion. Overall (total) the median
has been 17.4% with a narrow range from 16.3% to 18.6%. For crossbred supply in
Australia, the western production is immaterial, around 2%. On the other end of
the scale, western production has accounted for 28% of 19-micron production in
recent seasons (ranging from 27.5% to 32%). From 18 to 22 microns western
production has accounted for 22% to 28% of production during the past five
seasons, so these are the (merino) micron categories that face the greatest
supply risk from shrinkage in the Western Australian clip.

What does it mean?
The object of this article is not to guess what changes are occurring to the Western Australian sheep flock but to show how the impact of such change will be quite varied in its effect across the different micron ranges of Australian wool production. The key impact of change in Western Australian production is centred on 18 to 22-micron merino wool (the broader half of Australian merino wool production), with any effect on crossbred wool insignificant.
Have any questions or comments?

Key Points
- Western Australian wool production is concentrated in the 18 to 22-micron categories, making up 28% of 19-micron production in recent seasons.
- The Western Australian flock is mainly a merino flock, with a minimal contribution to Australian crossbred wool production.
- For the key 19-micron category a 20% fall in the western flock would translate into a 6% drop in the Australian supply of 19-micron wool, which is substantial.
Click on figure to expand
Click on figure to expand
Click on figure to expand
Data sources: AWTA, Mecardo