In March Mecardo wrote an article about down cycles in the 19 micron category, right on the cusp of significant price falls from the effects of COVID-19. What was not picked up at the time was that the pandemic was going to add an extra down cycle to the existing 2018-2019 season. This article takes a look at the Merino price with the pandemic effect fully recognised.
During the past three decades, Merino production has changed quality (fibre diameter) markedly, which makes the use of micron price guides (micron indicators) problematic. What was very fine in 1990 is now on the coarser side of the Merino average micron distribution. The other alternative, the overall market indicator (EMI), does a reasonable job but incorporates a large increase in the proportion of crossbred wool in the clip between 1990 and 2010. In its place a price series based on the average Merino fibre diameter (AMM) is used as a way of focusing on the average Merino price through time.
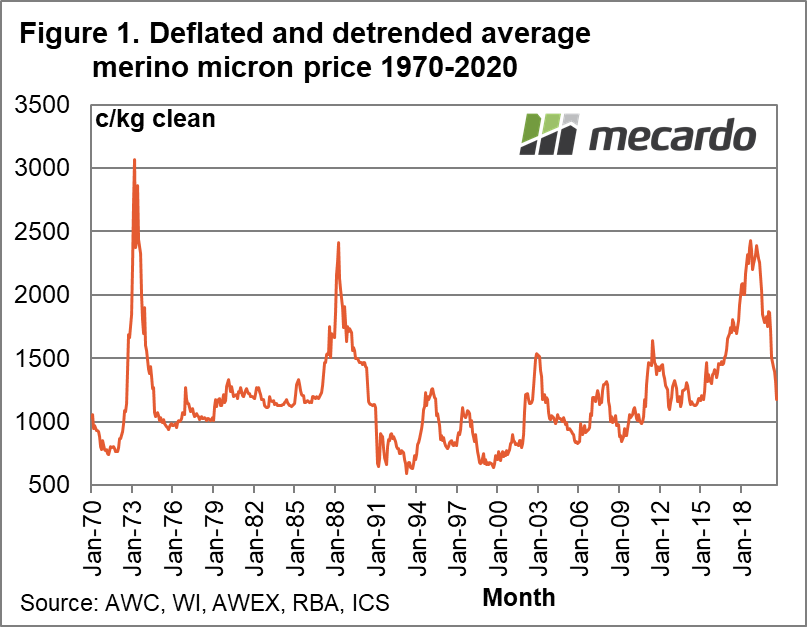
Figure 1 shows a price series for the AMM from 1970 to this month, adjusted for both inflation and then with the underlying trend removed. Both steps are imperfect in terms of showing us how prices from decades ago compare to now. The article last week on apparel fibre price trends showed that there have been varying trends (arguably three) in the price of fibres in the past 60 years. Given these caveats, the purpose of deflating and then de-trending the price series is to look at cyclical price movements in today’s price level terms.
In Figure 1 the recent 2018 cyclical peak was on par with the 1988 peak, and below the 1973 peak. Prices in the 1990s stand out as low, struggling as they did under high greasy stock levels. For the deflated and de-trended Merino price, down cycles have taken 21-28 months to complete since the mid-1980s, with prices falling 40%-45% on average.
In March the Merino price had fallen 29% in 18 months, which looked like the majority of the down cycle. Since then, COVID-19 has doubled the down cycle, adding another 31% fall in a mere five months. When the two down cycles are put together the Merino price is down by 52% in 23 months, which is looking like an average down cycle. However the economic effect of COVID-19 continues to play out so we must assume the down cycle has further to run.
Figure 2 shows the rolling variation of the Merino price from its lowest level of the preceding five years from 1970 onwards. The key rising price cycles stand out, dwarfed by 1973. The general rule of rising price cycles resulting in a 100% rise (a doubling of price) holds reasonably well.
Figure 3 (the reverse of Figure 2) shows the rolling variation in the Merino price from its highest level of the preceding five years. The current fall is now matching the down cycles of 2005 and 1999. The hope is we do not move on to match the past 1988 and post 1973 price falls.

What does it mean?
How this down cycle in wool prices continues to play out depends on how the pandemic plays out, and that is an unknown – a radical uncertainty in the words of John Kay and Mervyn King. So far the down cycle from 2018 is an average one, certainly greater than expected prior to early 2020 and COVID-19. At the minimum it would seem that the next 2-3 quarters will see relative weak demand, putting a potential recovery in the back end of this season if things improve. Looking much further ahead, how will we assess the next potential pandemic, as COVID-19 is the fourth such virus of the past two decades?
Have any questions or comments?
Key Points
- The Merino price fall since 2018 now matches the average down cycle of the past 35 years in terms of price fall (52%) and time taken (23 months).
- The unusual aspect of this downturn is the two separate factors involved, effectively joining two mild (as yet for the COVID-19 downturn) down cycles back to back.
- History shows there is room for more falls yet, given that the pandemic is still playing out.
Click on figure to expand
Click on figure to expand
Click on figure to expand
Data sources: AWC, WI, AWEX, RBA, ICS