The Meat and Livestock Australia (MLA) and Australian Lot Feeders Association (ALFA) quarterly survey data was released last week, and after a bit of volatility, the numbers have found a level early in 2023. There were however some significant moves around the country.
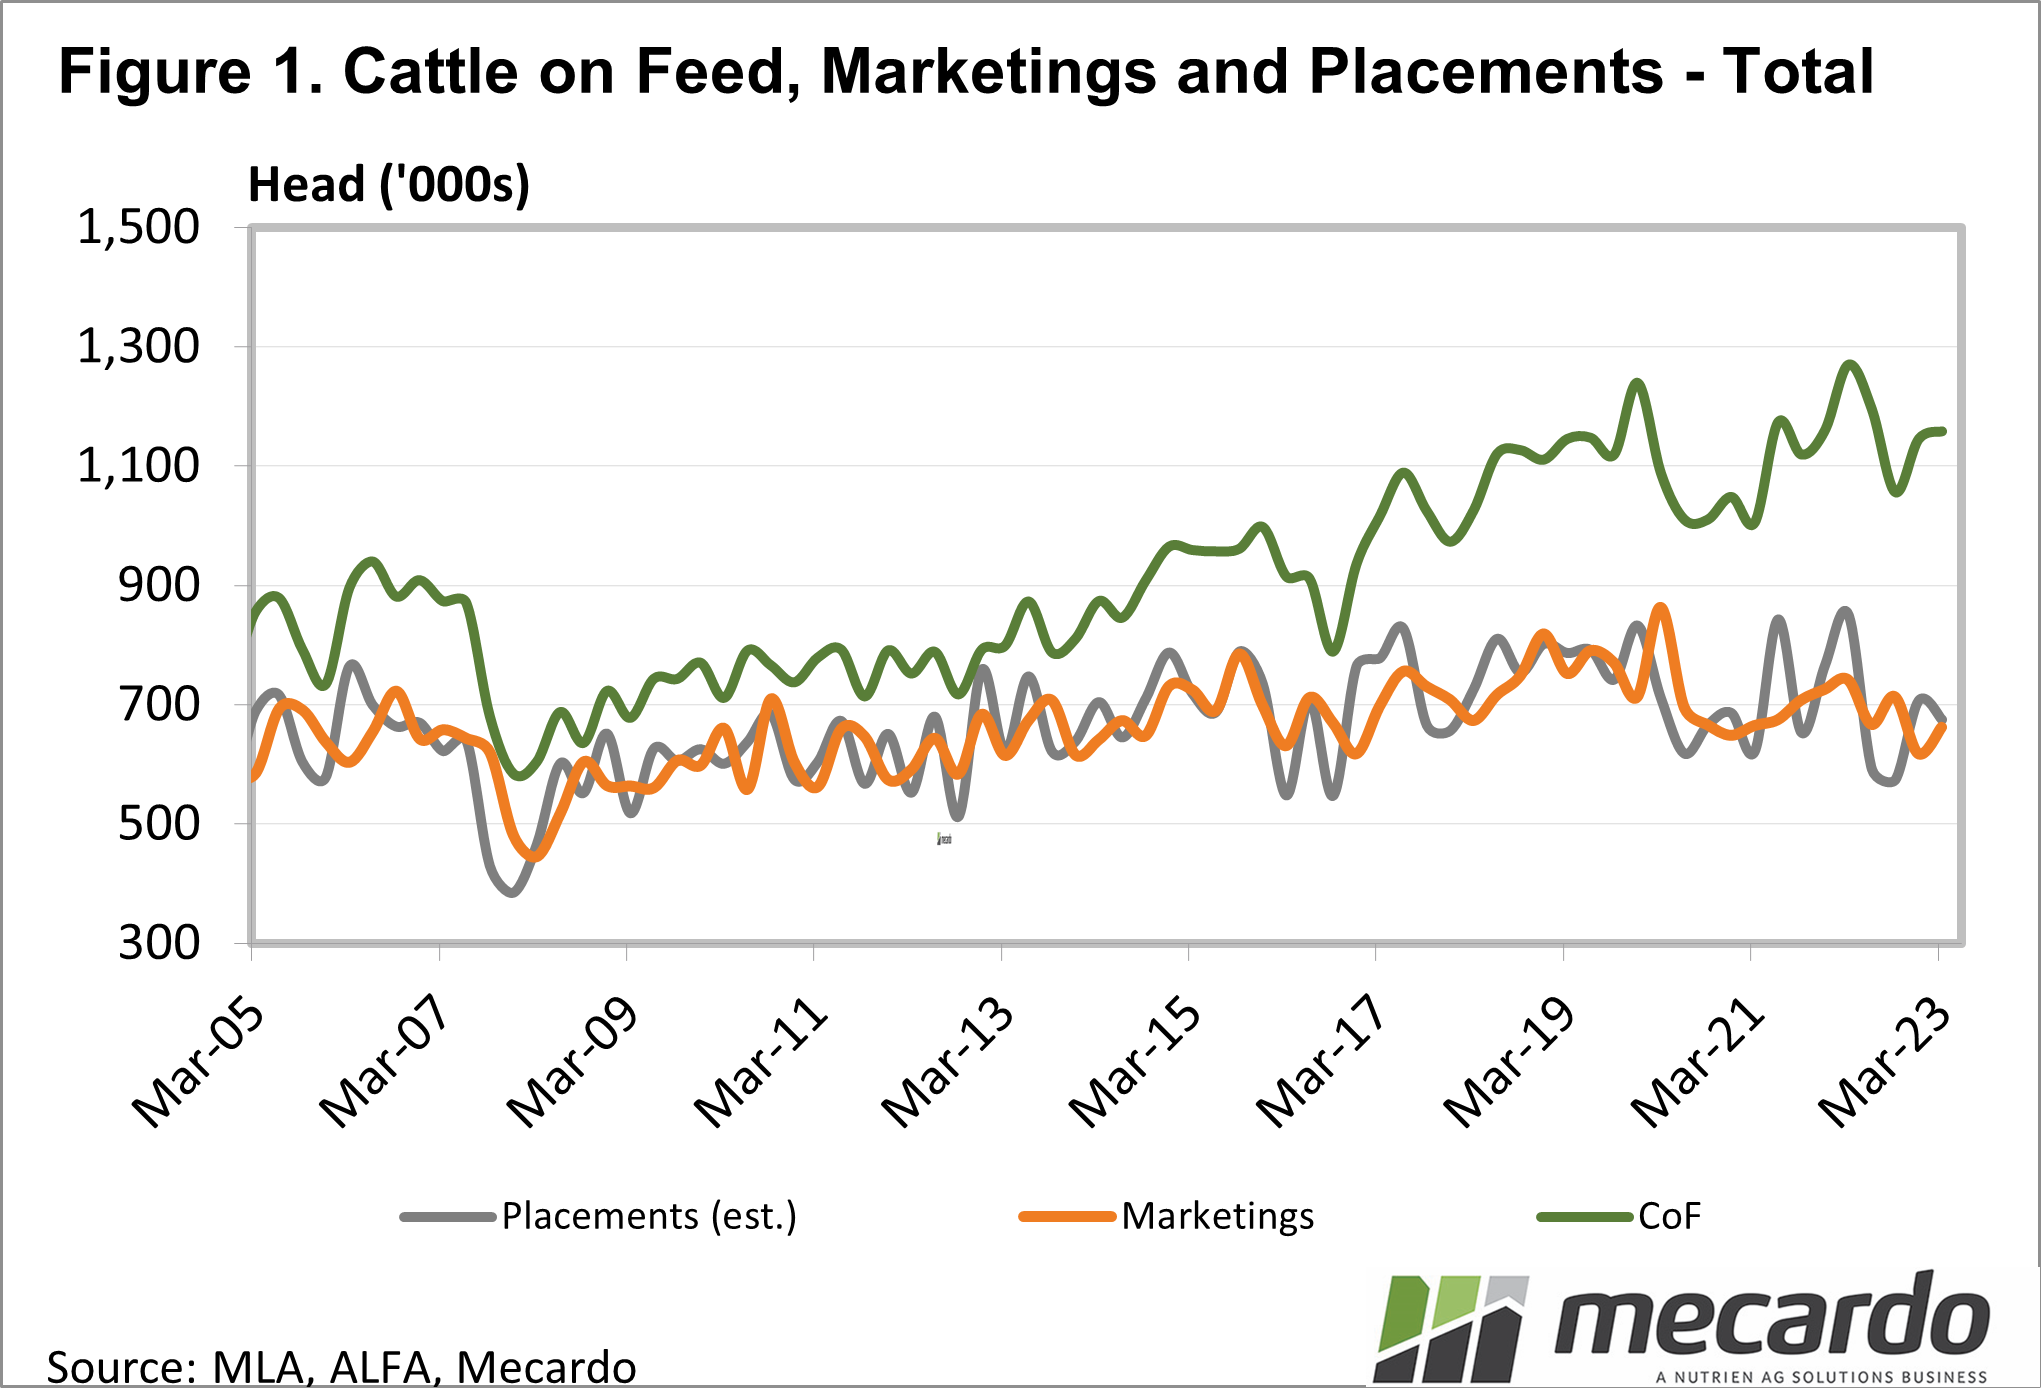
The headline number of cattle on feed was steady on the December quarter at 1.15 million head, the fifth highest end of quarter on record. Cattle on feed were down 9% on the March quarter of 2022, which was the peak of the cattle on feed (Figure 1).
Around the country, there were some significant moves in cattle on feed numbers. Queensland, the largest lot-feeding state, had 5% fewer cattle on feed than at the end of December, and 14% fewer than in March 2022. Queensland had the fewest number of cattle on feed since March 2021.
NSW, Victoria, and WA all recorded increases in cattle on feed in March, which is in line with the seasonal trend. With fewer grass-fed cattle available from southern cattle areas in Autumn and winter, more cattle go on feed to boost kill supplies.
The turnoff of cattle from feedlots, or marketings, was higher in March, up 7% on December, driven by increases in all states except South Australia. Marketings were 11% lower than March 2022, largely due to there being fewer cattle on feed to hit the market.
The number of cattle going into feedlots fell on both December and March 2022. Declines of 5% and 21% respectively likely reflect tighter margins for feeders, rather than weakening supply of cattle, especially compared to last year. Queensland placements of cattle on feed were back to the lows of June and September last year.
NSW still placed plenty of cattle on feed, with numbers up 10% on December and down just 1% on March 2022.
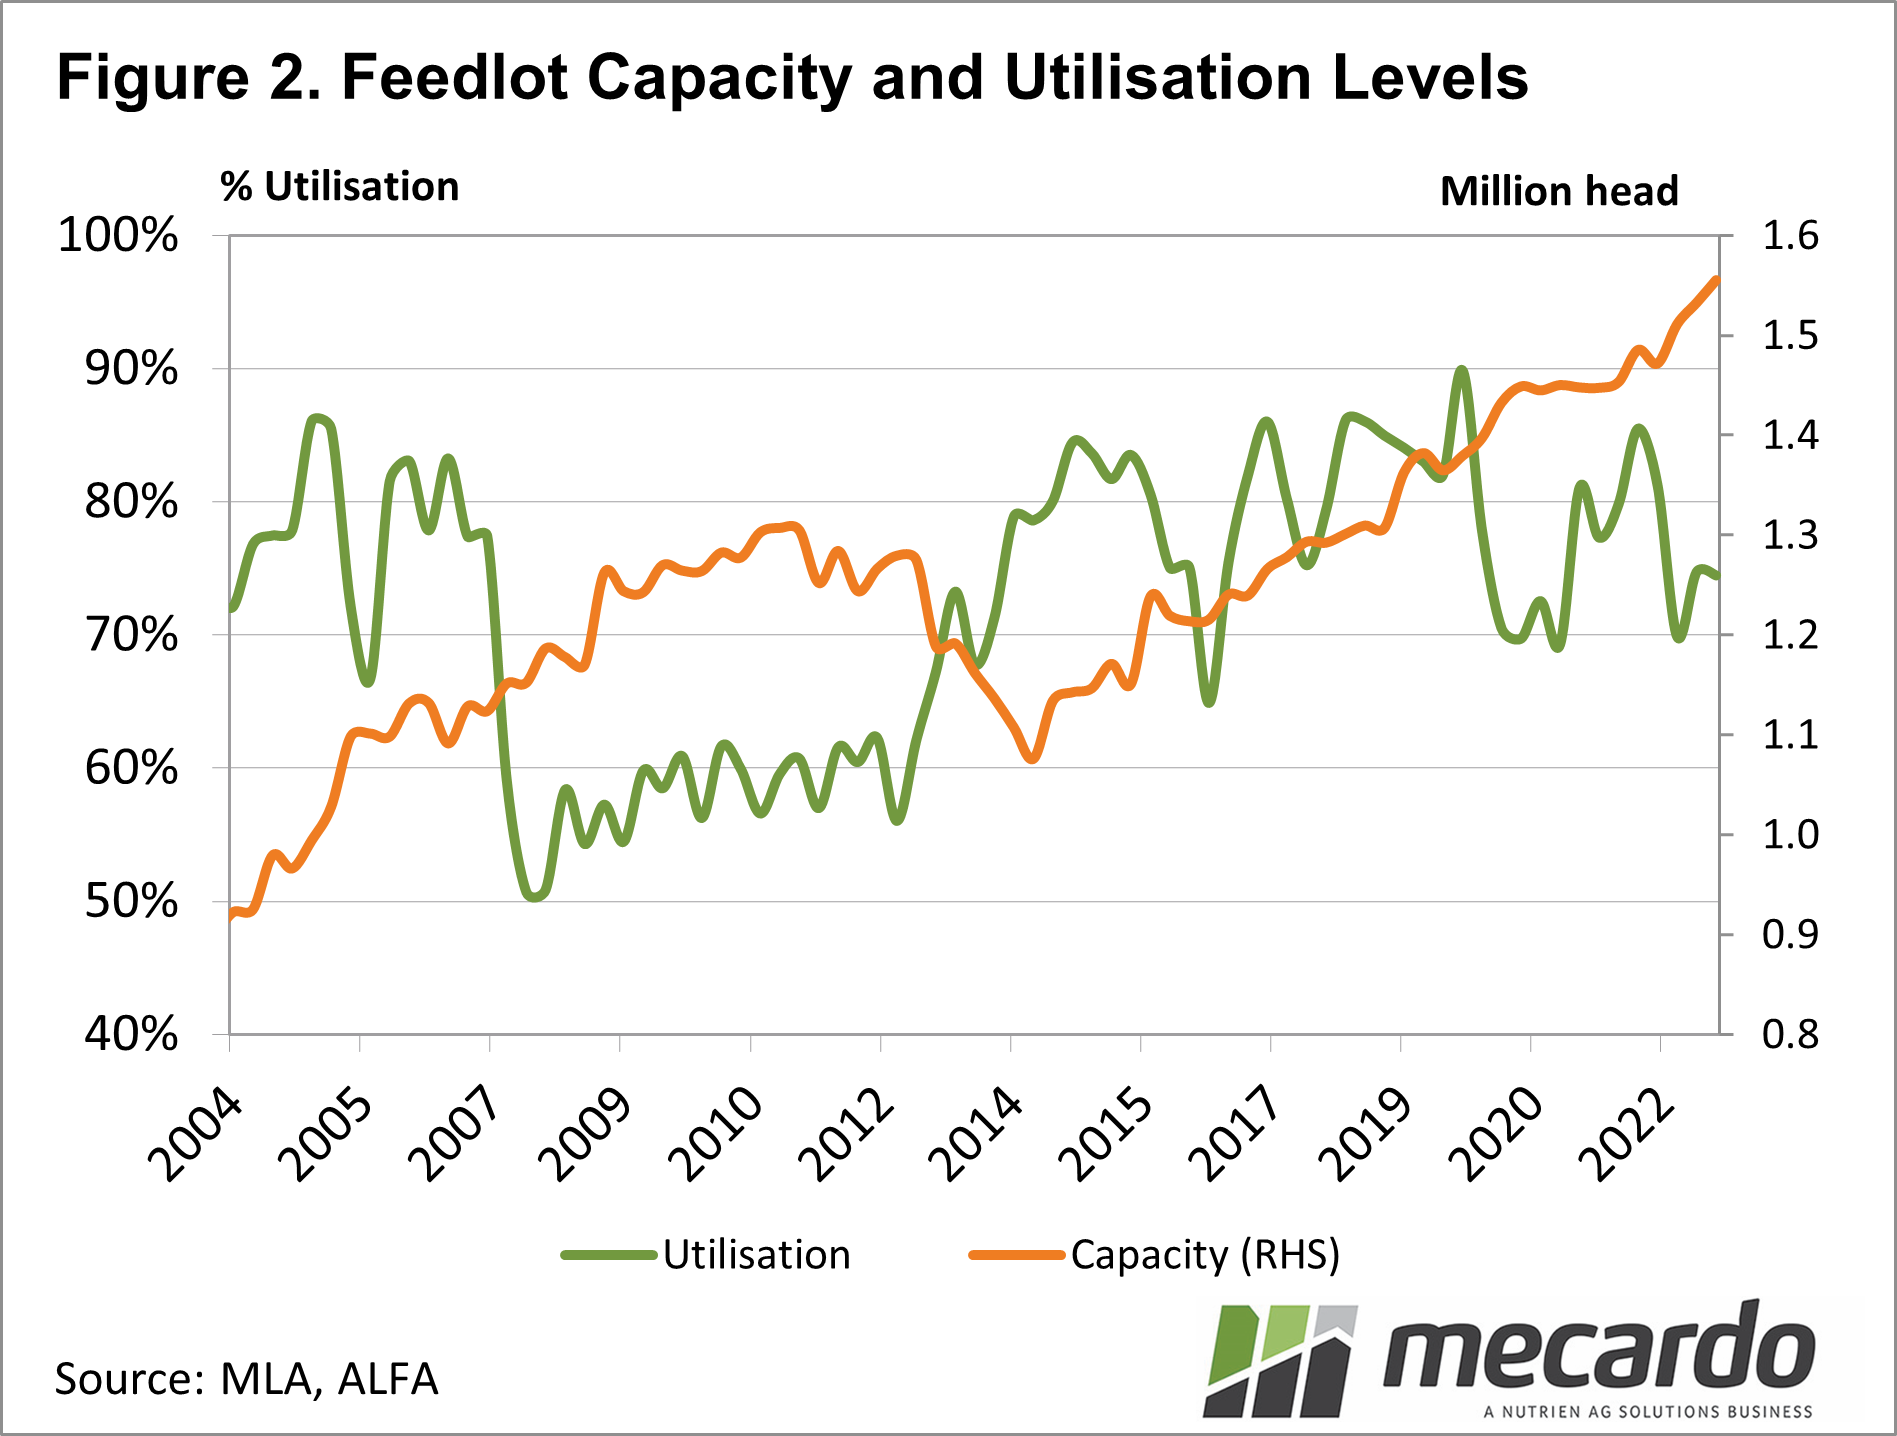
It’s interesting to see in Figure 2 that despite the number of cattle on feed having fallen from their peaks, capacity continues to grow. With feedlot utilization at 75%, there is plenty of space available, and this again points to tighter trading conditions than we saw when utilization was over 80% during 2021 and 2022.

What does it mean?
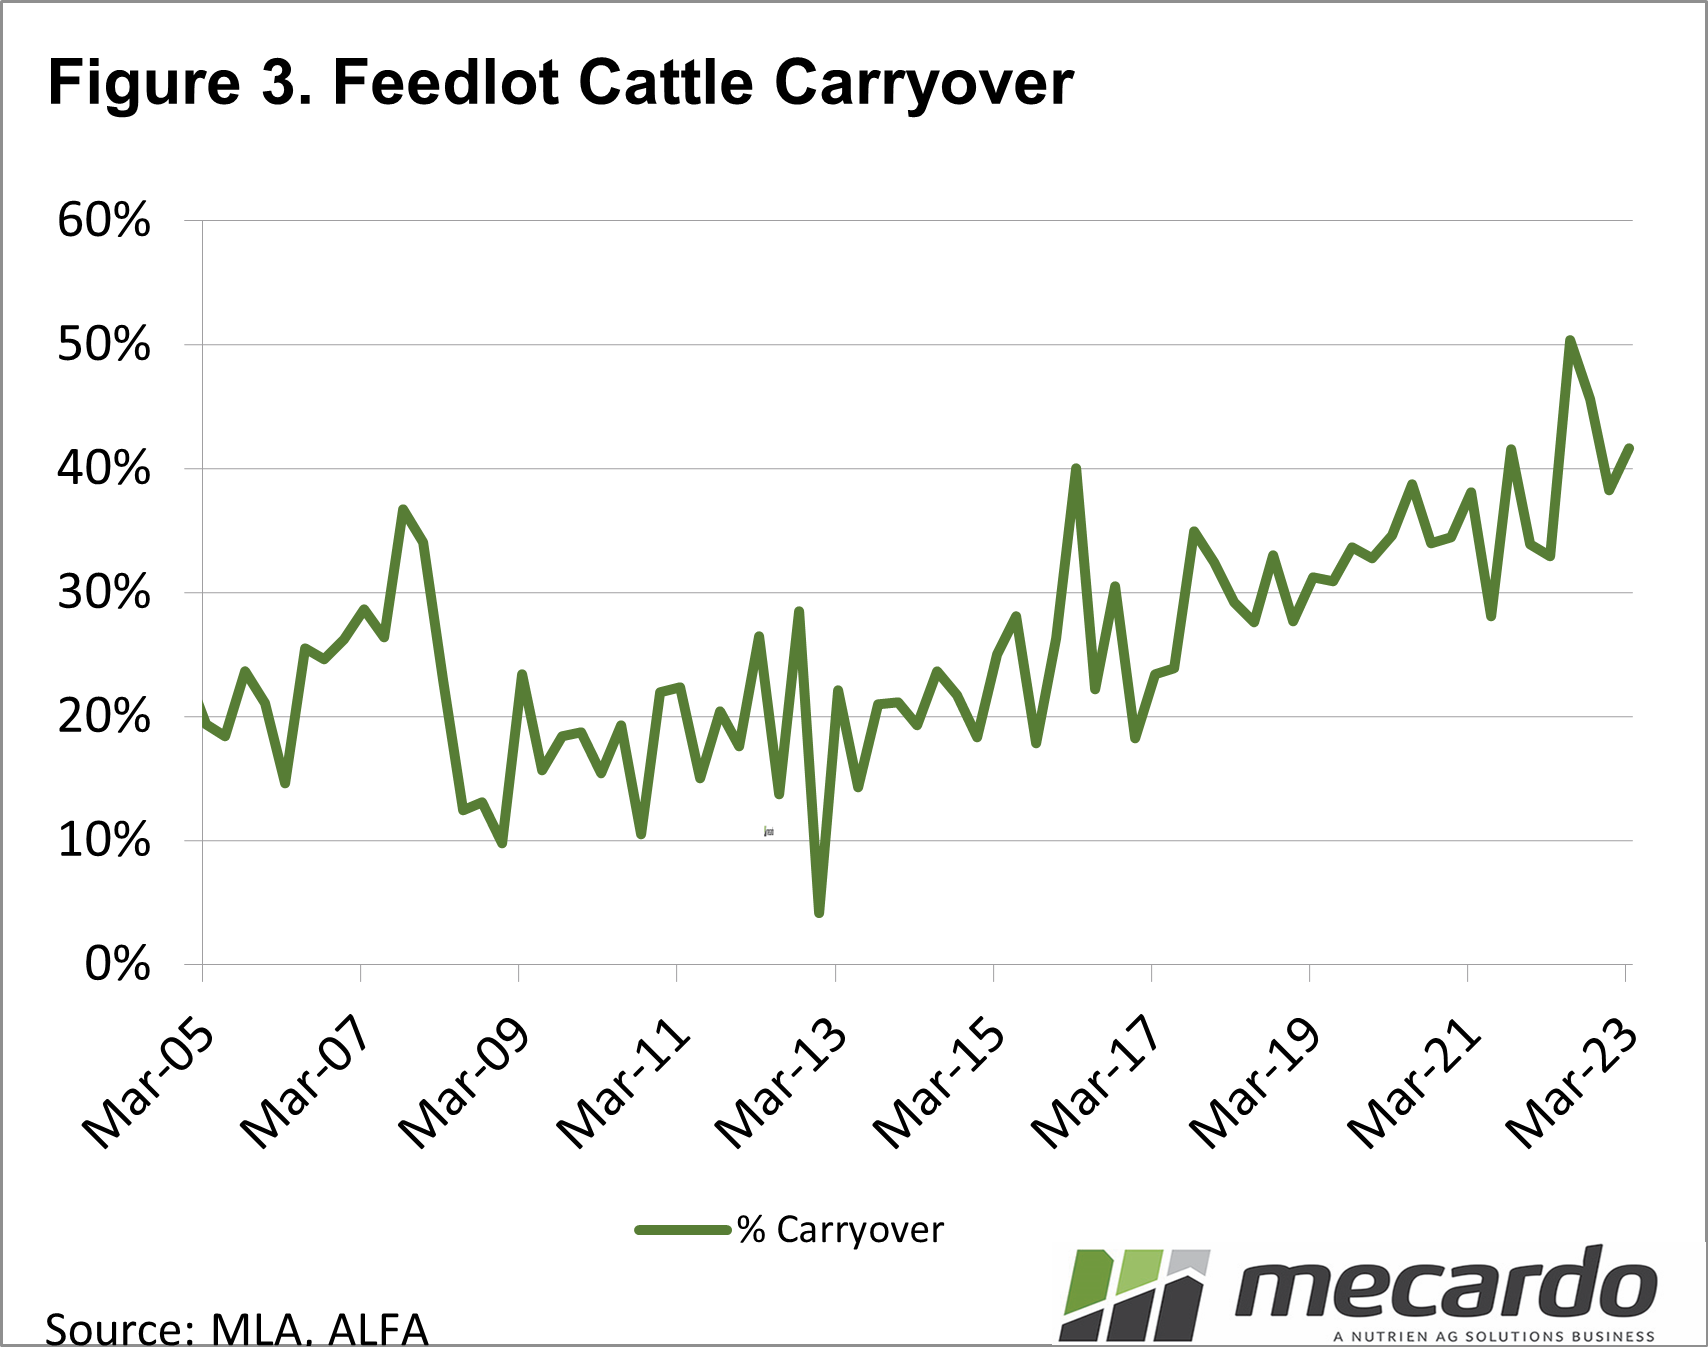
Figure 3 shows the proportion of cattle that were carried over the quarterly reporting period. That is the proportion of cattle that have been on feed for three months or more and are likely to be marketed imminently. We can see carryover remains strong, with plenty of cattle having been on feed for more than three months likely helping to lift slaughter rates now.
For those selling feeders, trading conditions will determine whether prices can move higher to replace large numbers coming out this quarter, or whether utilization will fall further.
Have any questions or comments?

Key Points
- Cattle on feed numbers were steady on December, but well down on the March 2022 peaks.
- Feedlot utilisation is down, an indication of tougher trading conditions.
- High carryover numbers are helping lift slaughter rates this quarter.
Click on figure to expand
Click on figure to expand
Click on figure to expand
Data sources: ALFA, MLA, Mecardo