A couple of weeks ago; a prominent news outlet posted a rather dramatic article headlined with ‘plummeting wool price” and mention of a bloodbath week of auctions. When viewed on a daily timeframe the article may have had some basis but it seemed overdone, which raised the question about what is the best way by which to judge whether a market is a “bloodbath” or not.
When discussing the greasy wool market, the first thing to do is acknowledge the wide range of wool categories which in turn have a wide range of end uses, and in doing so can have a wide range of prices. “Wools ain’t wools”. For this article we look at the 19 micron category which is the average micron range of the Australian merino clip, give or take half a micron, and has been for over a decade. The merino clip is the dominant component of the Australian wool clip by volume and value.
The question raised by the article about how to assess a market is not going to be answered in this article. However we can suggest that taking a longer timeframe for assessment of prices is a better perspective, and more practical as it will show how the price levels achieved by the majority of wool sellers (in this case).
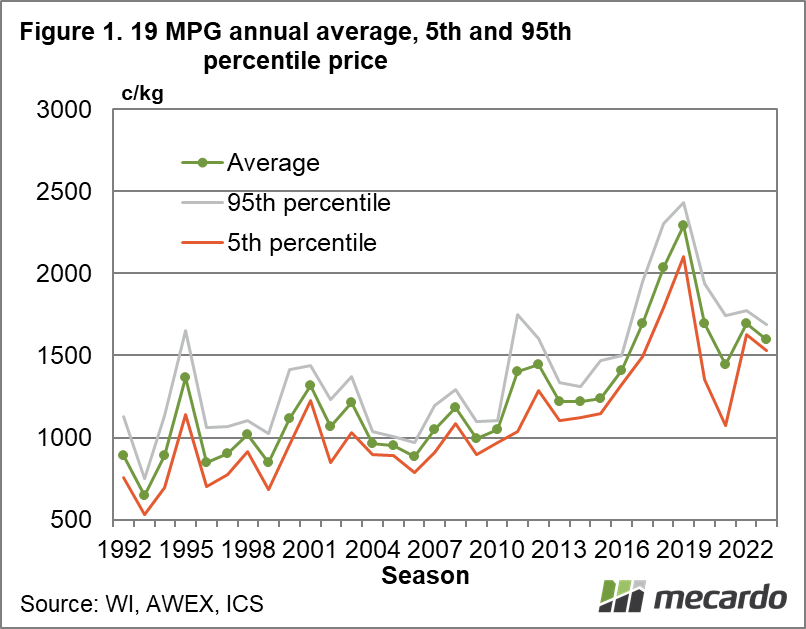
Figure 1 shows the season average price (unweighted daily average) for the eastern 19 MPG from 1991-92 to the current season (to date), along with the 5th (low) and 95th (high) price percentiles for the 19 MPG each season. The percentiles show the price range around the average for each season. Have a look at where the current season is tracking, with the average price marginally below last season and 2019-20, and well above 2020-21. That is why the ABC article seemed inaccurate. The 5th percentile price seemed to reinforce this view with lows of 202-21 substantially worse than the current season.
For readers who wish to see deflated prices, Figure 2 adjusts the Figure 1 data for inflation and brings prices up to current value levels. Adjusting for inflation takes some of the shine off the current price levels, and puts the 19 MPG with 50-80 cents of the cyclcial lows of the past decade. The low 5th percentile reminds of the 2020 August market which was a very tough one, and it is this market which dragged the 5th percentile so low for that season.
In mid-November Mecardo looked at the relationship between the average auction price for 19 micron and the 19 MPG, showing how the average price as a proportion of the 19 MPG had improved during the past two decades.
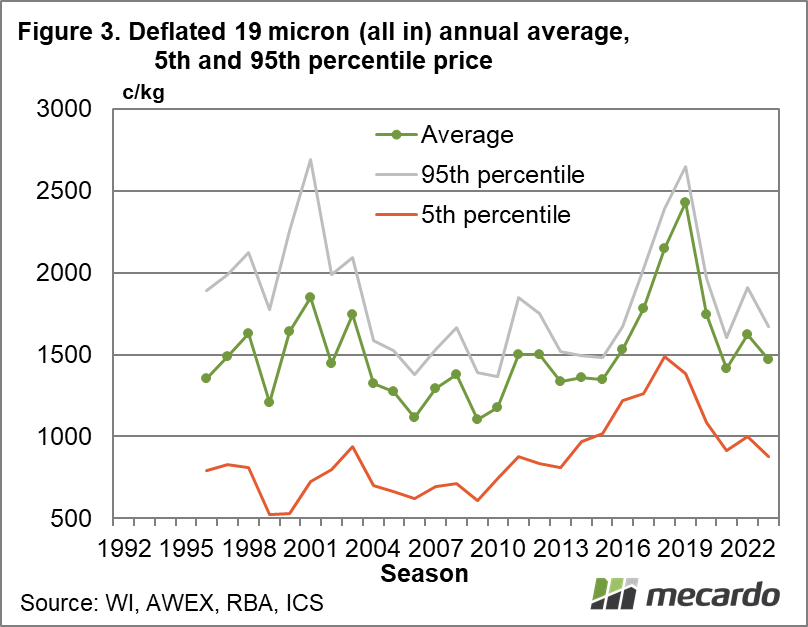
Figure 3 shows the deflated annual average price for 19 micron (all wool included – stains, cardings and so on), along with the 5th and 95th price percentile for this series. The 5th percentile is quite low because it will be made up of the aforementioned stains, dags and so on. As an aside this is why micron indicators are produced, so price changes can be shown while minimising the impact of varying quality (something that is not always easy to do).
Figure 3 shows the current season average price for 19 micron wool (all in) is running above the 2020-21 season and 110-120 cents above the 2013-2015 years. Current season deflated prices for 19 micron might not be spectacular but they are running around median for the past two decades. Given the problems in the world that is a good result.

What does it mean?
As much as marketers like to think otherwise, wool is a commodity, a raw input into a long and involved supply chain. Such supply chains amplify changes in demand as the signal flows back upstream to our greasy wool markets, underpinning volatility in raw wool prices. So, wool price go up and down. In reporting on markets it is preferable to maintain a balanced perspective by watching prices beyond the week to week and month to month movements.
Have any questions or comments?

Key Points
- Assessment of markets needs to take into account a longer timeframe to provide perspective.
- The 19 MPG is performing reasonably well this season, when looked at in seasonal average terms, in view of the problems in the world.

Click on figure to expand
Data sources:
WI, AWEX, RBA, ICS