On the back of the herd rebuild, cattle slaughter has started to rise to begin the year. Meat and Livestock Australia’s (MLA) weekly cattle slaughter data has hit a peak, but it’s Queensland that is driving the increase.
East coast cattle slaughter has started the year on a high. At least it’s a high compared to the last two years. If we look back a bit further we can see it has a long way to go to get back to the levels we saw last time the herd was this size.
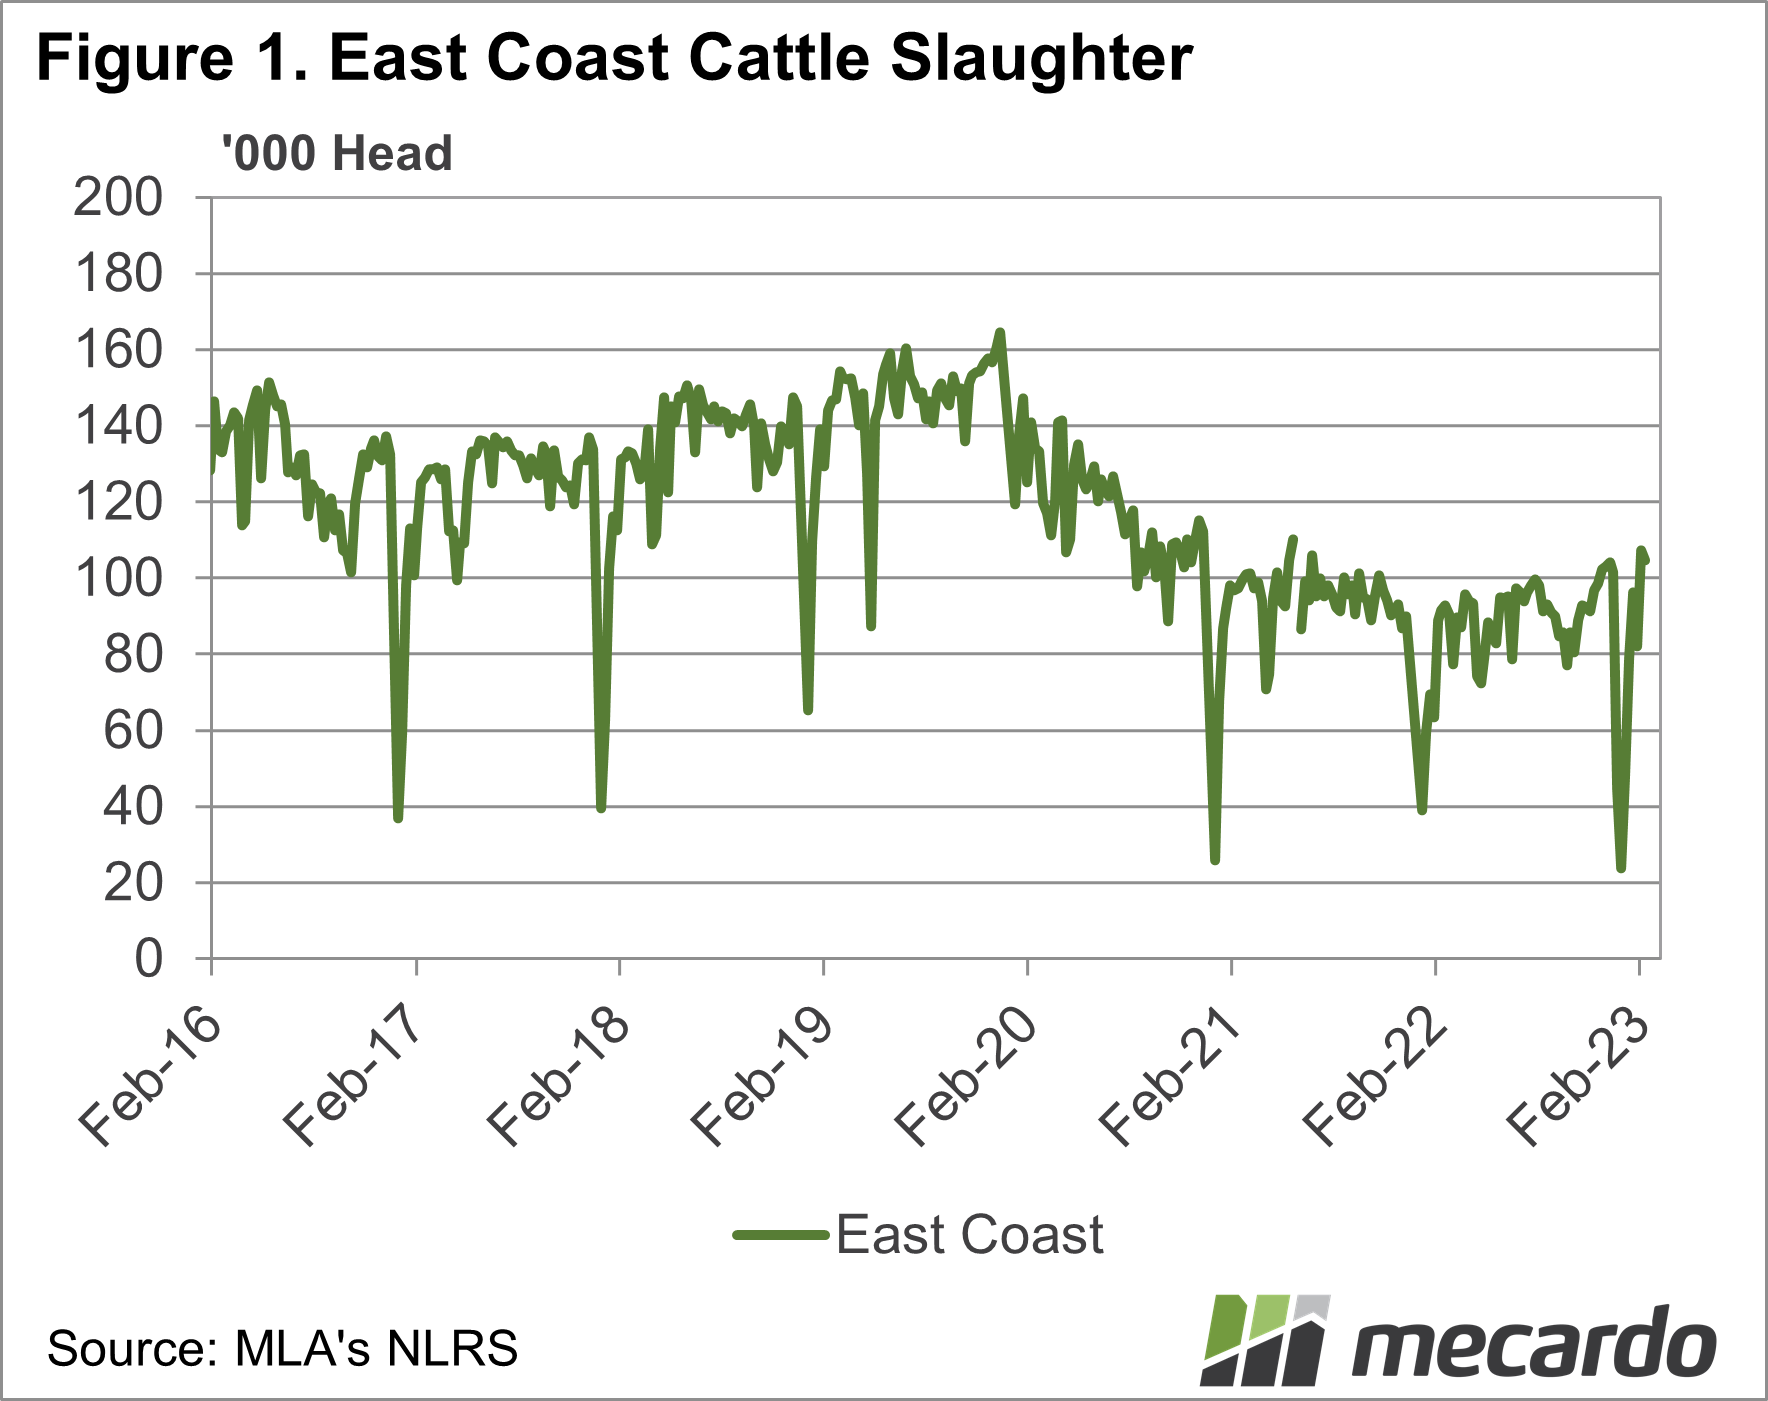
Figure 1 shows that east coast cattle slaughter sat at just over 105,000 head in the first two weeks of February. Both these weeks were above any level we saw in 2022, and 2021 saw just one higher week. So it is fair to say that compared to the last two years cattle slaughter is running hot.
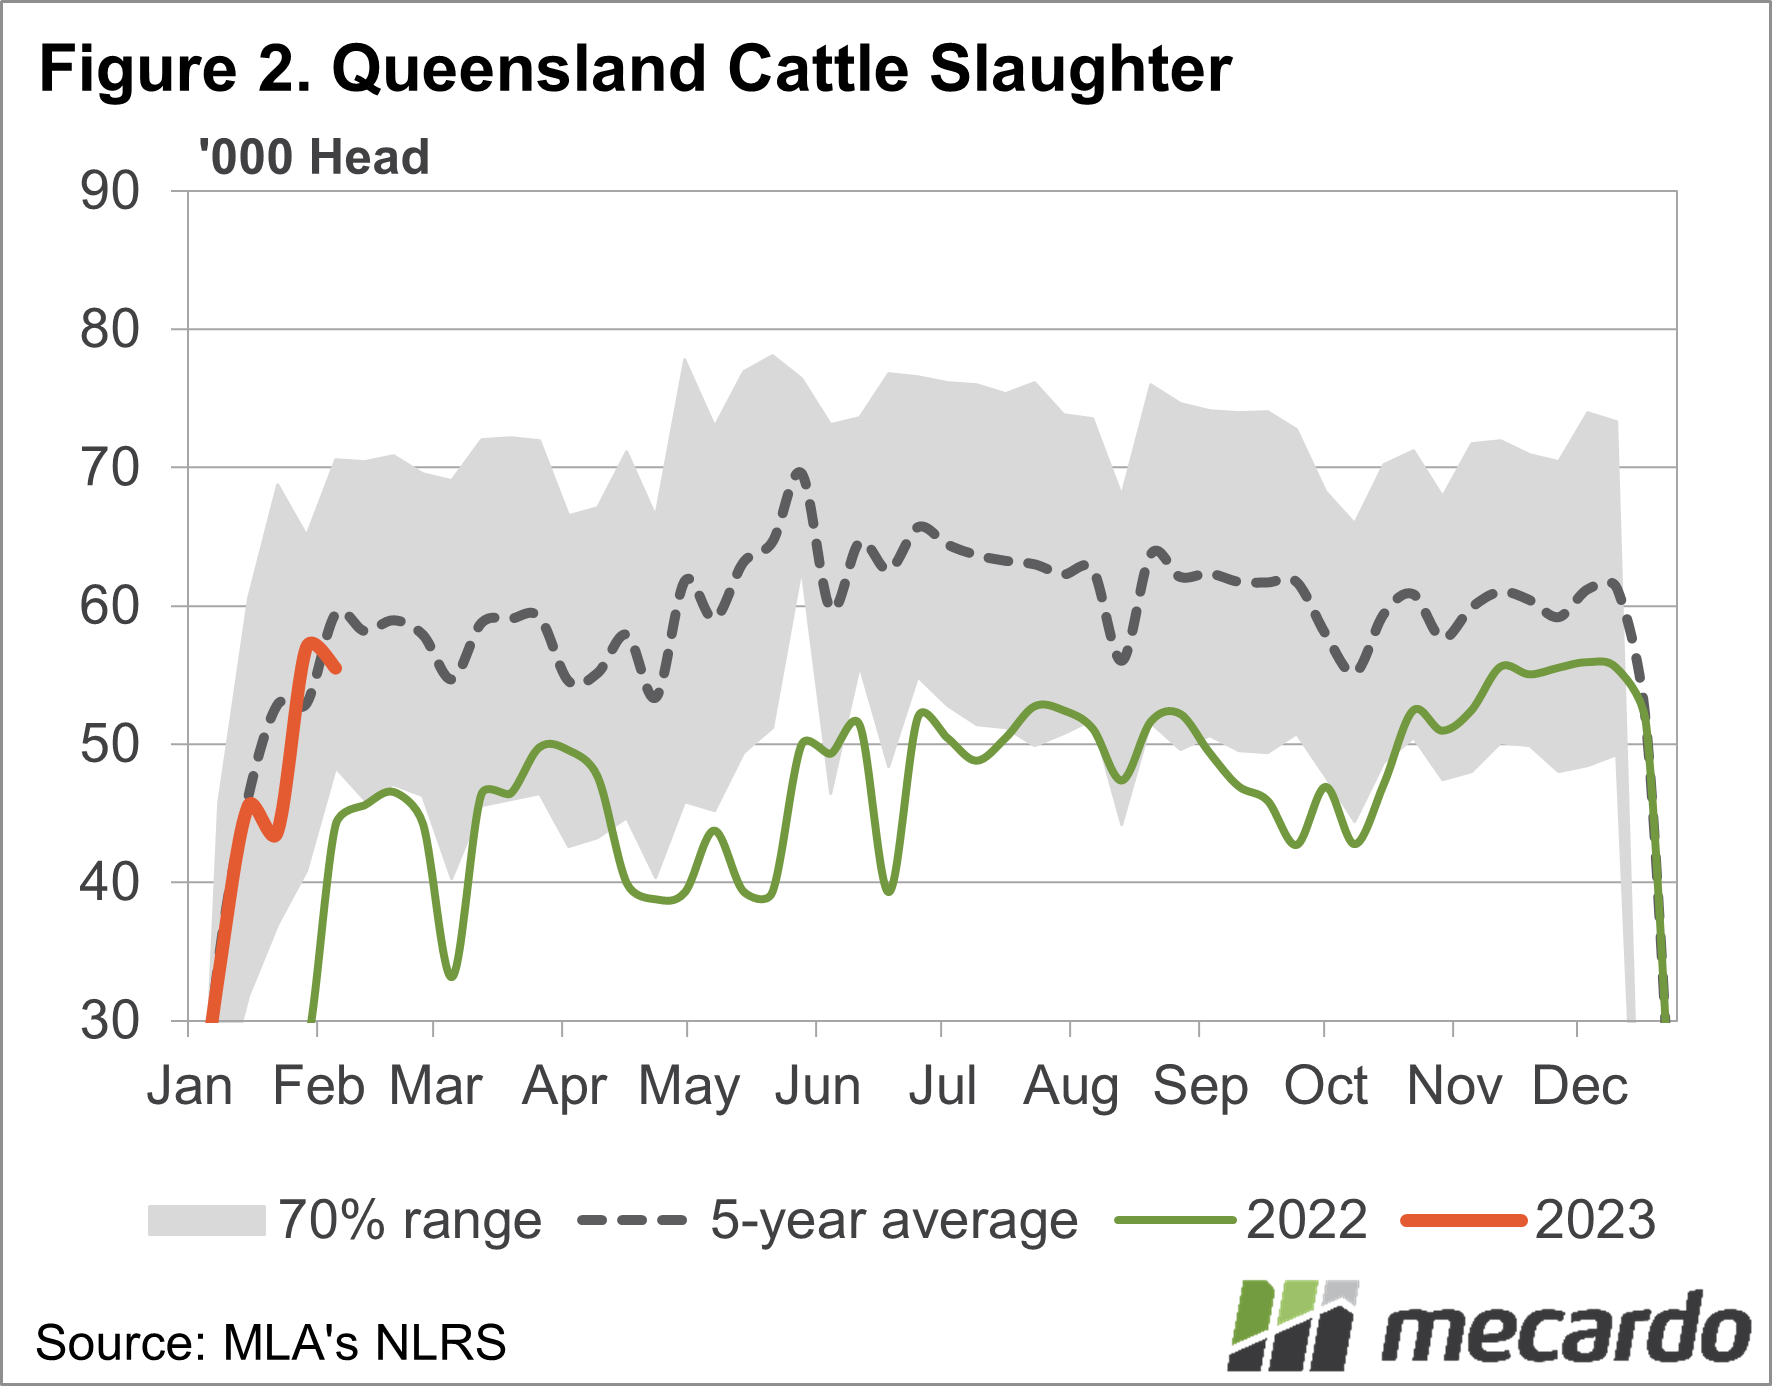
There is a strong contrast between early 2023 slaughter levels in the north and south. Figure 2 shows Queensland cattle slaughter is back at its five-year average. In the week ending February 10, Queensland cattle slaughter was up 25% on the same week in 2022.
NSW cattle slaughter is also higher, up 10% on last year. The stronger calf numbers of the last two years are starting to work their way through northern markets.
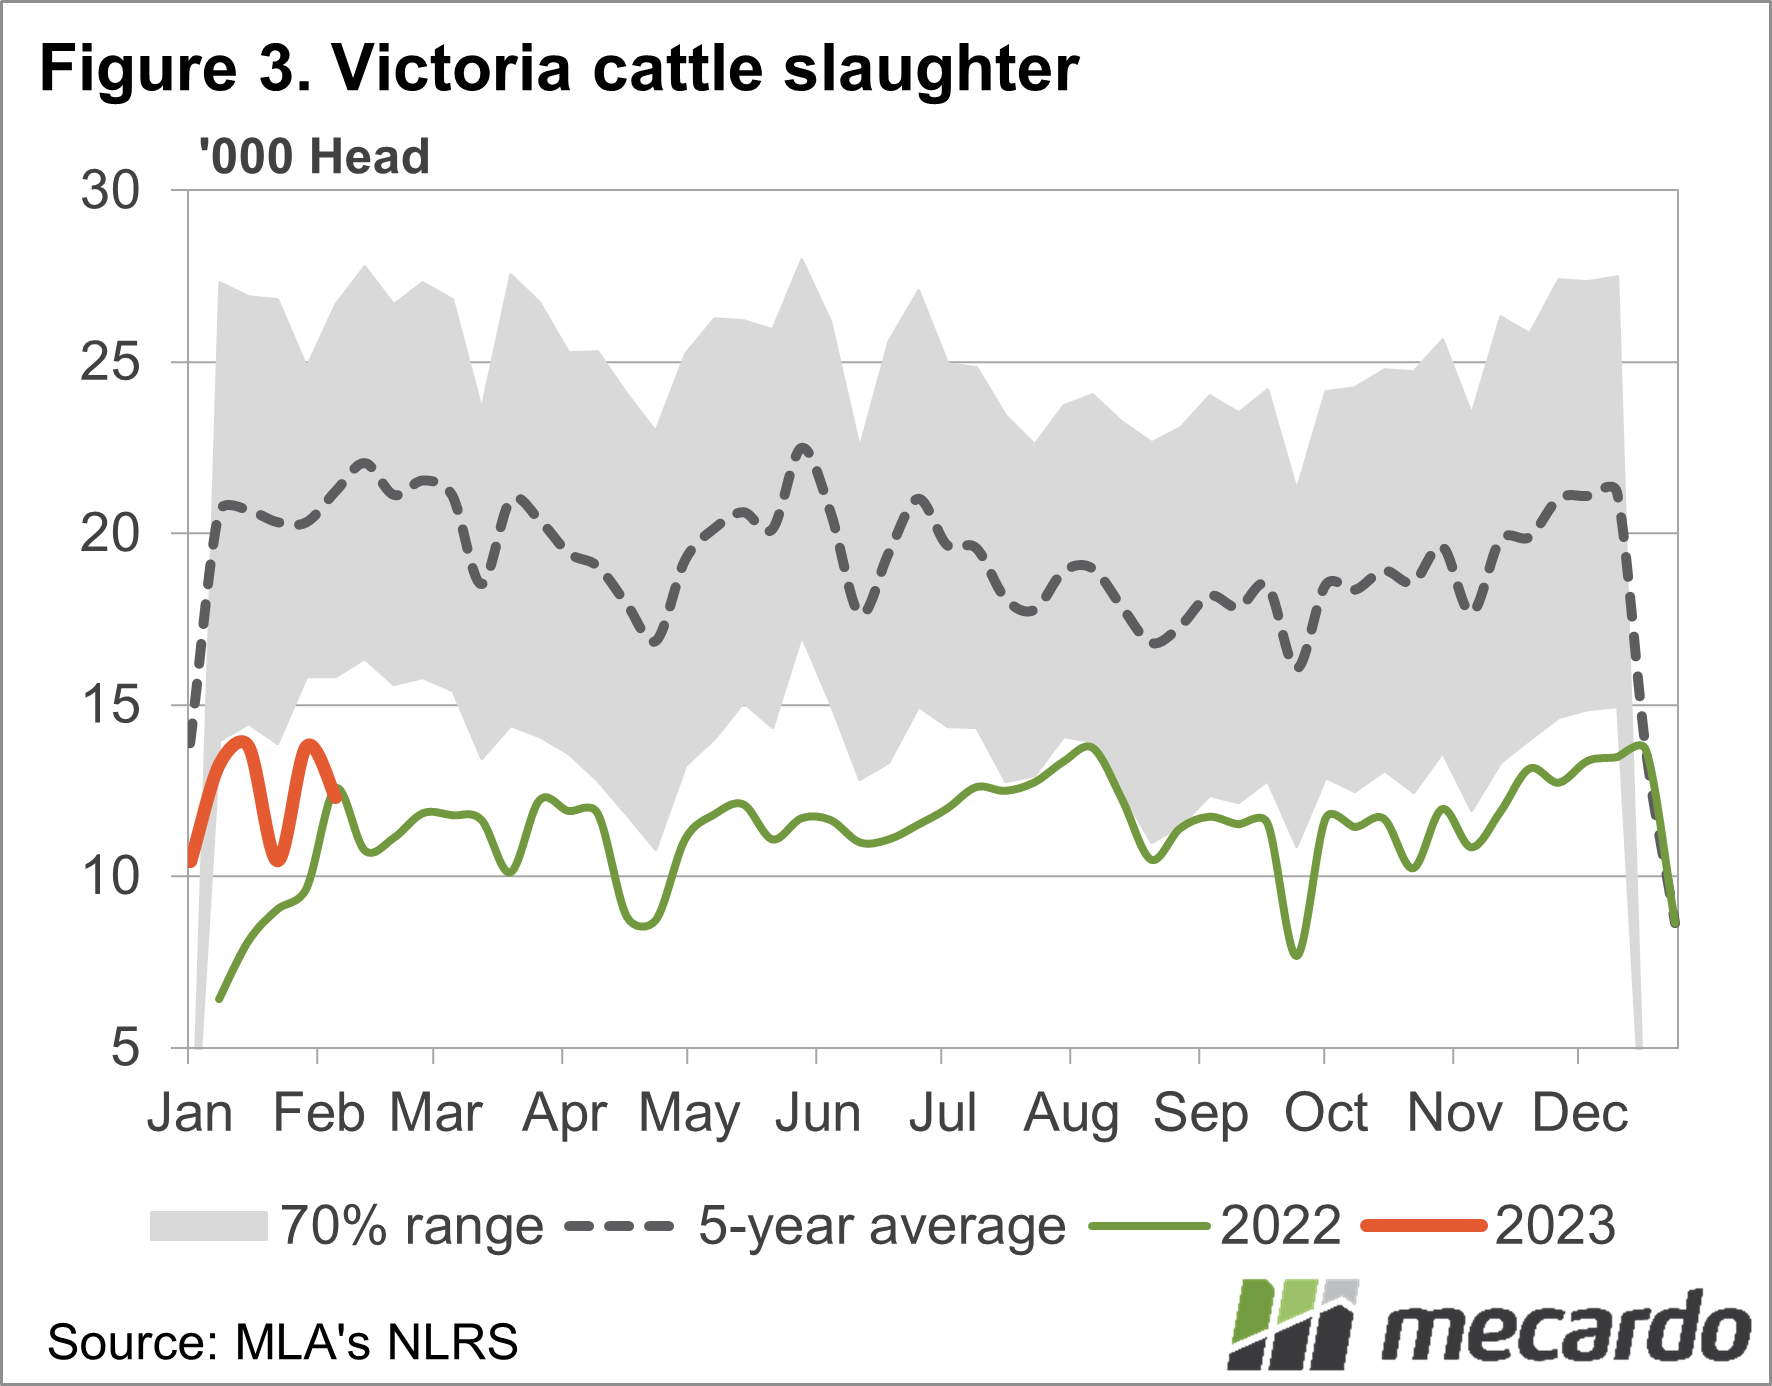
Victoria and South Australia are smaller cattle slaughter states, but important nonetheless. The southern states contributed 16.5% of east coast slaughter on average in 2022. Both Victoria and SA have failed to see slaughter increase from rebuild levels just yet.
Figure 3 shows Victorian cattle slaughter continuing to track along at levels similar to the peaks of 2022. We can see in figure 1 that Victoria is still at only 60% of the five-year average level and less than half the peaks of 2018-19.
Looking at MLA’s slaughter forecasts, current rates should be close to catering for the 6.62 million head expected to be slaughtered this year. Annual slaughter is forecast up 7.3% on 2022, and current rates will end up seeing 15-20% processed for the year.

What does it mean?
While MLA weekly slaughter figures suggest we are well on track to meet or beat 2023 slaughter forecasts, figure 1 shows processors are a long way off slaughter levels for a 28 million head herd.
In 2017 the herd was at 28 million, and it was static into 2018. Over those years weekly cattle slaughter was 130-140 thousand head per week. All states will have to increase capacity to account for a herd this large if it eventuates.
Have any questions or comments?

Key Points
- East Coast cattle slaughter has started February at two-year highs.
- Queensland is the leading contributor to higher slaughter rates, while southern states are similar to last year.
- Cattle slaughter is on track to meet forecasts but will have to increase to account for a larger herd.
Click on figure to expand
Click on figure to expand
Click on figure to expand
Data sources: MLA, Mecardo