Longer run trends, by their nature, tend to be overlooked in the week to week or month to month discussion of markets because they are generally not material to short term fluctuations in price. However longer term trends tend to be cumulative in their effect on price, with enough time, and so become material to price levels. This article takes a look at supply and price for broader merino.
For this article the AWEX eastern 21 MPG is compared to a weighted (by volume) average price for non-wool staple fibres (cotton, which is the largest, acrylic, polyester and viscose). Prices are shown in US dollar terms and have been adjusted inflation (US inflation available at https://www.minneapolisfed.org/about-us/monetary-policy/inflation-calculator/consumer-price-index-1913- )
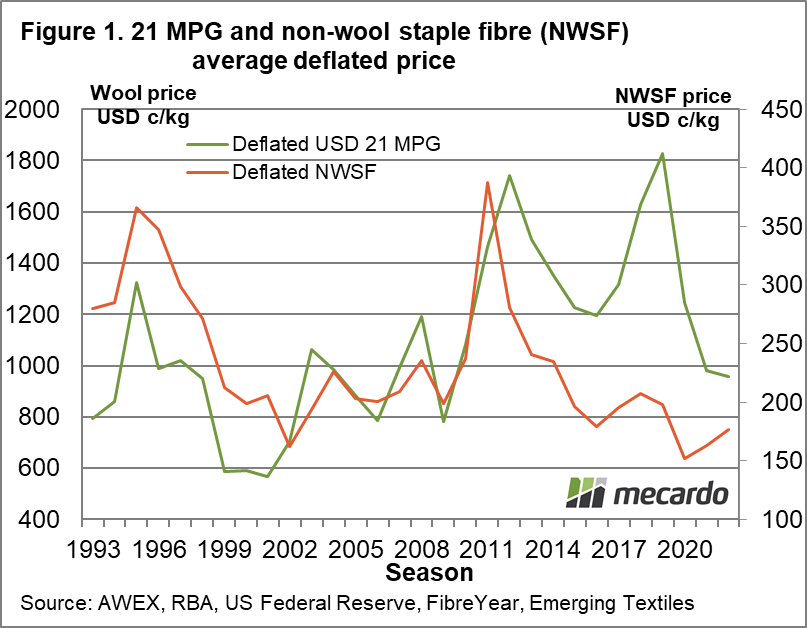
Figure 1 shows annual average prices for the 21 MPG and the non-wool staple fibre (NWSF) series from 1992-93 through to last season. While the 21 MPG has struggled in the past couple of seasons, it has generally outperformed the NWSF price since 2011. Keep in mind these are prices adjusted for inflation, to recent values.
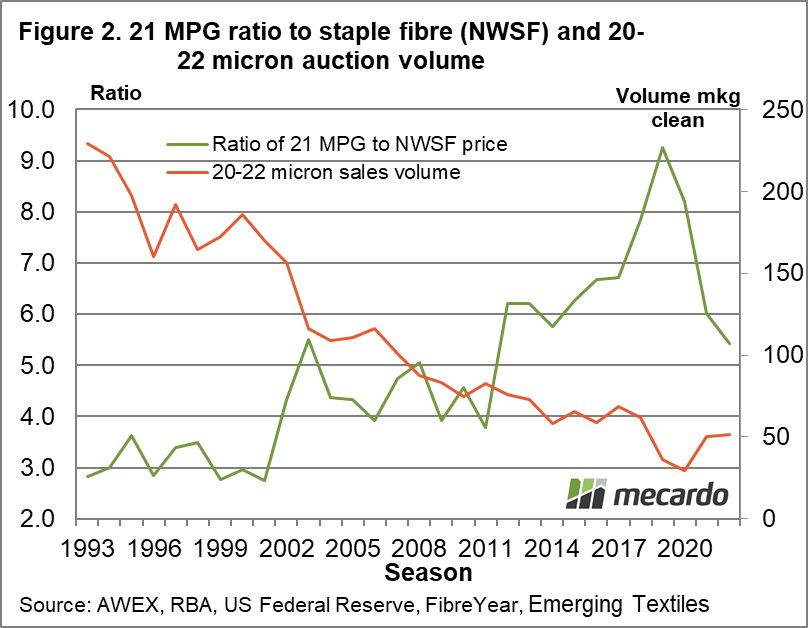
In Figure 2 the ratio of the 21 MPG the NWSF (from Figure 1) is compared to the Australian auction sales volume of 20-22 micron wool for the same period. The ratio stayed low (around three) during the 1990s, as the market struggled to liquidate the stocks left over from the Reserve Price Scheme. These were finally cleared in August 2001, and the greasy wool market went through its usual post stockpile rising price cycle. The sales volume of 20-22 micron wool, after steadying in the late 1990s, trended lower from around 2000 through to 2013-14. In this period it fell from 186 mkg clean to 58 mkg clean, a fall of 70%. The price ratio had lifted in 2002, from 1990 levels, to the 4-5 range. After 2011 the price ratio picked up again, and then was given a further boost in 2017-2019, as supply fell during the severe eastern drought of that period.
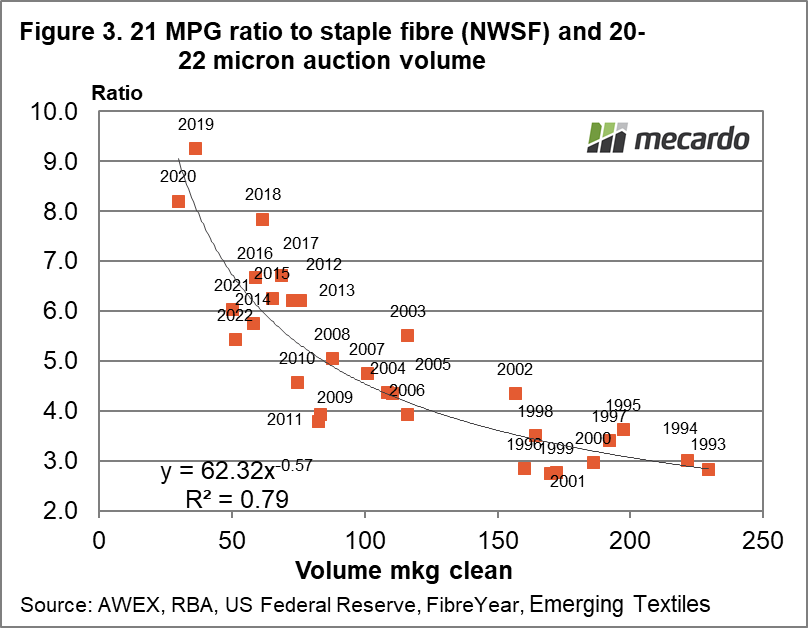
Figure 3 takes the data used in Figure 2 to compare directly volume with the price ratio, and run a trend line through this comparison. As mentioned earlier in the late 1990s the price ratio was around three, with volume in the 200 mkg clean range. By 2018-2020, when volume was around 30 mkg clean the ratio peaked in the 8-9 range. A simple power regression across the data shows that supply accounts for around 80% of the change in price ratio during the past three decades. In 2021-22 the 20-22 micron volume had rebounded to 50 mkg clean and the price ratio had slid back down the trend, plus some to 5.4.
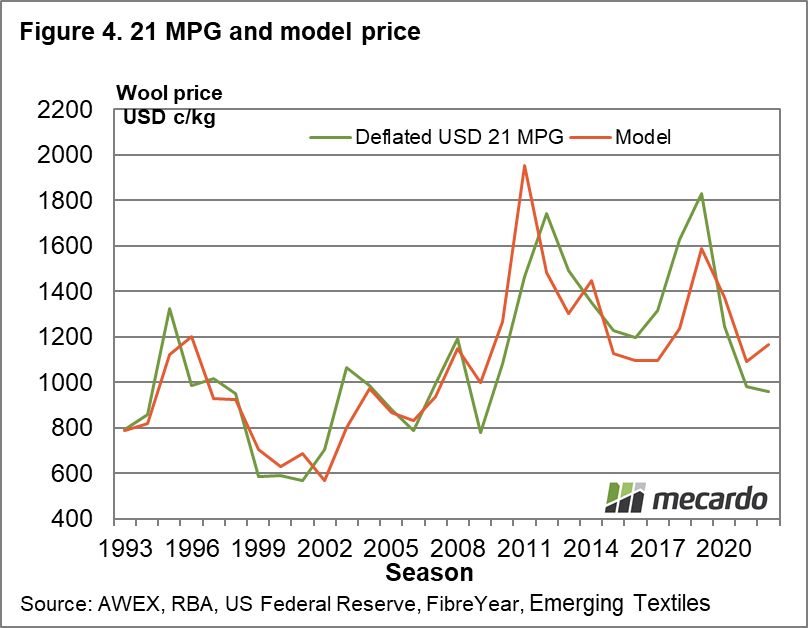
In Figure 4 the trend in Figure 3 is applied to the NWSF price series of Figure 1 to come up with a simple historical model price of the 21 MPG, and this is compared to the actual 21 MPG. The model does a good job of explaining the 21 MPG (in deflated US dollar terms) during the past three decades, using the non-wool staple price as a base and the volume of 20-22 micron to drive the price ratio. This simple analysis shows that 20-22 micron volume plus the general price level for staple fibres can account for around 70% of price levels for the 21 MPG in recent decades.

What does it mean?
While the modelling shown here is of hindsight, it shows the importance of volume on price levels relative to staple fibre prices generally for broader merino wool, and further, the influence of price levels in the general apparel fibre market. These factors set the base price level, upon which secondary factors apply their influence to greasy wool prices.
Have any questions or comments?

Key Points
- Volume and the general price level of staple fibres are the key drivers of broader merino prices.
- From this perspective demand is channeled to the wool market via the price levels of the other staple fibres.
- The impact of marketing therefore is of secondary influence, at best.
Click on figure to expand
Data sources: AWEX, RBA, US Federal Reserve, FibreYear, Emerging Textiles