Premiums for quality integrity scheme accredited wool have certainly been a highlight of the greasy wool market in the past year, at least for wool from South African, New Zealand and Australia. For Australia the key management consideration with regards to these schemes is the cessation of mulesing. This article takes a look at the rates of CM-NM wool in the merino clip.
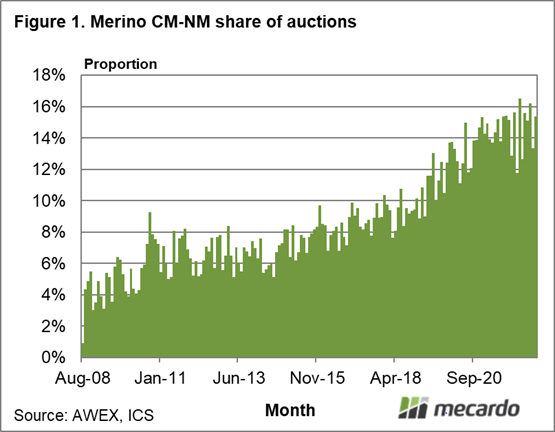
Declaration of non-mulesed wool offered for sale in Australia began in 2008. Figure 1 shows the monthly proportion of merino wool which is declared as CM (ceased mulesed) and NM (non-mulesed) from 2008 until last month. As the schematic shows the proportion rose from 2008 through to 2010 and steadied around 6%, before starting to lift from 2015. Since 2020 the proportion has steadied again, around 14-15%.
During the past year in the merino clip CM-NM wool has made up 15.3% of merino sales (clean basis), which accounts for 12% of overall sales (all breeds). AA (analgesic/anaesthetic) declared merino wool made up 44.7% of sales during the past 12 months.
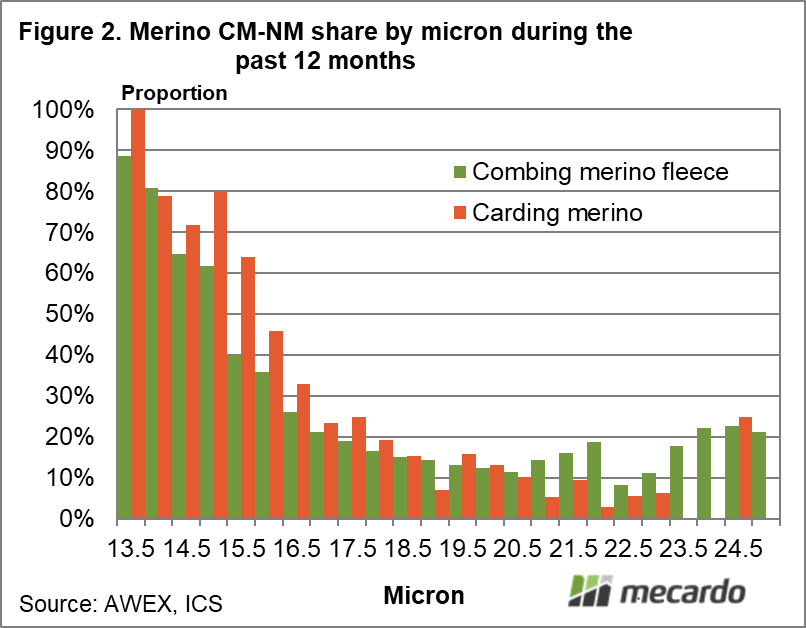
What does the adoption rate of CM-NM look like across the micron ranges? Figure 2 shows the proportion (by half micron increments) eastern merino wool sales during the past year which were declared as CM-NM, for combing fleece (50+mm staple length, vegetable matter 0-2%, sound, no subjectively assessed faults beyond a broker H1) and merino cardings (locks and crutchings). This is a subset of the overall merino supply in Australia.
The CM-NM proportion rises as the fibre diameter becomes finer, from around 19 micron (the average merino micron). It rises from 14% to 80%+ for 14 micron and finer. For combing merino fleece the CM-NM proportion the average to broader microns is between 10% and 20%. There is plenty of CM-NM wool in the finer merino micron categories, but the proportion for the big volume categories is stuck in the 10% to 20% range.
Crossbred wool makes up 20% of auction sales volume by clean weight, but only 34.2% of crossbred sales during the past year have been declared CM-NM, which equates to 7.1% of overall (all breed) sales. In total some 22.4% of wool sold at Australian auctions (all breeds) was declared as CM-NM in the past 12 months, with another 28% declared as AA (nearly all merino).

What does it mean?
Mulesing or the lack of it is a sticking point for many wool growers, when it comes to quality integrity schemes. At this stage only 15% of the merino clip sold at auction is declared as CM-NM, and only one third of the crossbred clip. This is a structural block to meaningful increases in the adoption of quality integrity schemes in the Australian wool clip.
Have any questions or comments?

Key Points
- The proportion of CM-NM declared merino wool sold at auction has been around 14-15% for the past two years.
- The finer merino micron categories have much higher CM-NM declarations compared to the average and broader merino micron categories.
- Only one third of crossbred wool is declared as CM-NM.
Click on figure to expand
Click on figure to expand
Data sources: AWEX, ICS, Mecardo