Supply patterns in the greasy wool market feed into the price structure of the market. These patterns do change with time so this article takes a look at supply (defines as AWTA core test volumes) patterns in recent seasons versus two decades ago.
Traditionally spring shearing delivered a flush of wool to the market, helping to push spring prices lower. December and July tend to be periods of low supply/sales. Christmas holidays and crop harvests limit wool supplies in December, while a lack of sales and mid-winter limit July supply.
Figure 1 compares the average seasonal pattern of AWTA core test volumes for 17 micron wool for the three seasons to 2002-2003 to the pattern for the three seasons to 2021-2022. The data is available on the AWTA website . Two decades ago 31% of 17 micron wool was tested in October and November. Supply was heavily weighted to the Australian spring months, with the superfine market traditionally going into its off season after the last designated superfine sale in February.
Twenty years on, the seasonal pattern for 17 micron wool has flattened out markedly. During the past three seasons March was the month which had the highest proportion of wool tested. The October and November volumes only totalled 18% of the full season volume. The buy side of the market has had to adjust its interest in the fine merino greasy market, spreading purchases out through the season as the wool becomes available.
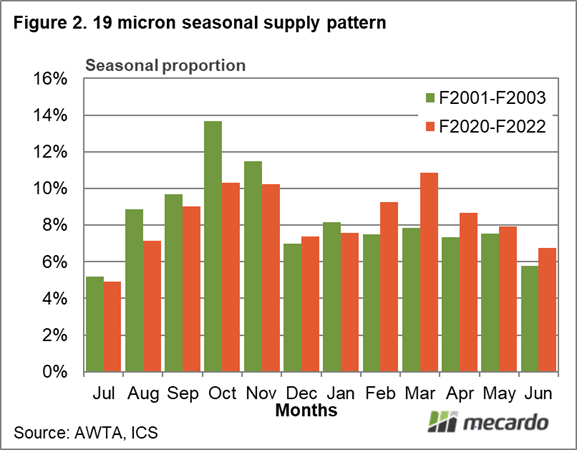
Figure 2 repeats the exercise for 19 micron wool. Two decades ago the supply was skewed to the spring months, but not to the extent of 17 micron. A similar change has taken place with supply spreading out more evenly across the season, with March now the main month by volume by a small margin compared to October and November.
Seasonal patterns of supply for 21 micron are compared in Figure 3. Here too, the supply through the season has spread out, with peaks in the spring and autumn.
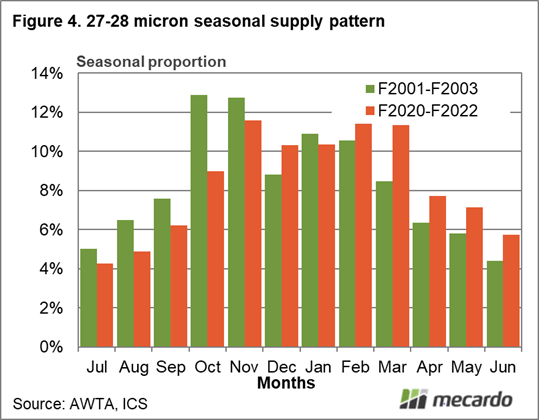
Finally Figure 4 compares seasonal supply patterns for 27-28 micron wool. Some of the previous October/November volume has shifted to February/March. The big supply months for crossbred wool are between October and March.

What does it mean?
Given the shortage issues with shearers and shearing shed staff, a more even supply of wool through the season makes some sense. In terms of prices, a move away from a big spring flush for fine merino wool will result in less downward pressure on a market where the supply chain is often waiting for some direction from retail sales.
Have any questions or comments?

Key Points
- The concentration of greasy wool supply in the spring has declined during the past two decades, with the supply spreading out more evenly across the full season.
- This change in seasonal pattern is more pronounced for the finer merino categories.
- Less wool in the spring seems to be a good thing, as wool demand is often weaker at this time as the supply chain waits for feedback from the northern hemisphere autumn/winter retail season.

Click on figure to expand
Click on figure to expand

Click on figure to expand
Data sources: AWTA, ICS