With the release of the March official slaughter figures from the Australian Bureau of Statistics (ABS) last week we saw numbers we haven’t seen in some time, in terms of tight supply. The tight supply also gives reason for some price concerns for growers for the rest of the year.
March is usually a low slaughter month for lamb and sheep due to the larger than normal number of public holidays, but this March set some new lows. Official lamb slaughter for Australia came in at 1.73 million head.
The usual number-crunching makes for interesting reading. March lamb slaughter was down 12% on 2019, and was at the lowest level since 2014. Lamb slaughter under 1.8 million head is usually reserved for the winter supply dearth and December.
March continued a string of lower year on year slaughter rates, which is now out to six, and has pushed the 12 month rolling average monthly slaughter to levels not seen since 2012. Figure 1 shows the decline in slaughter rates has been pretty consistent since the peak of May 2018.
Lamb slaughter averaged 1.95 million head per month in the 12 months to May 2018. The year to March 2020 saw the average slaughter rate fall 10% from the peak to 1.755 million head. The drought impact is certainly biting on supply.
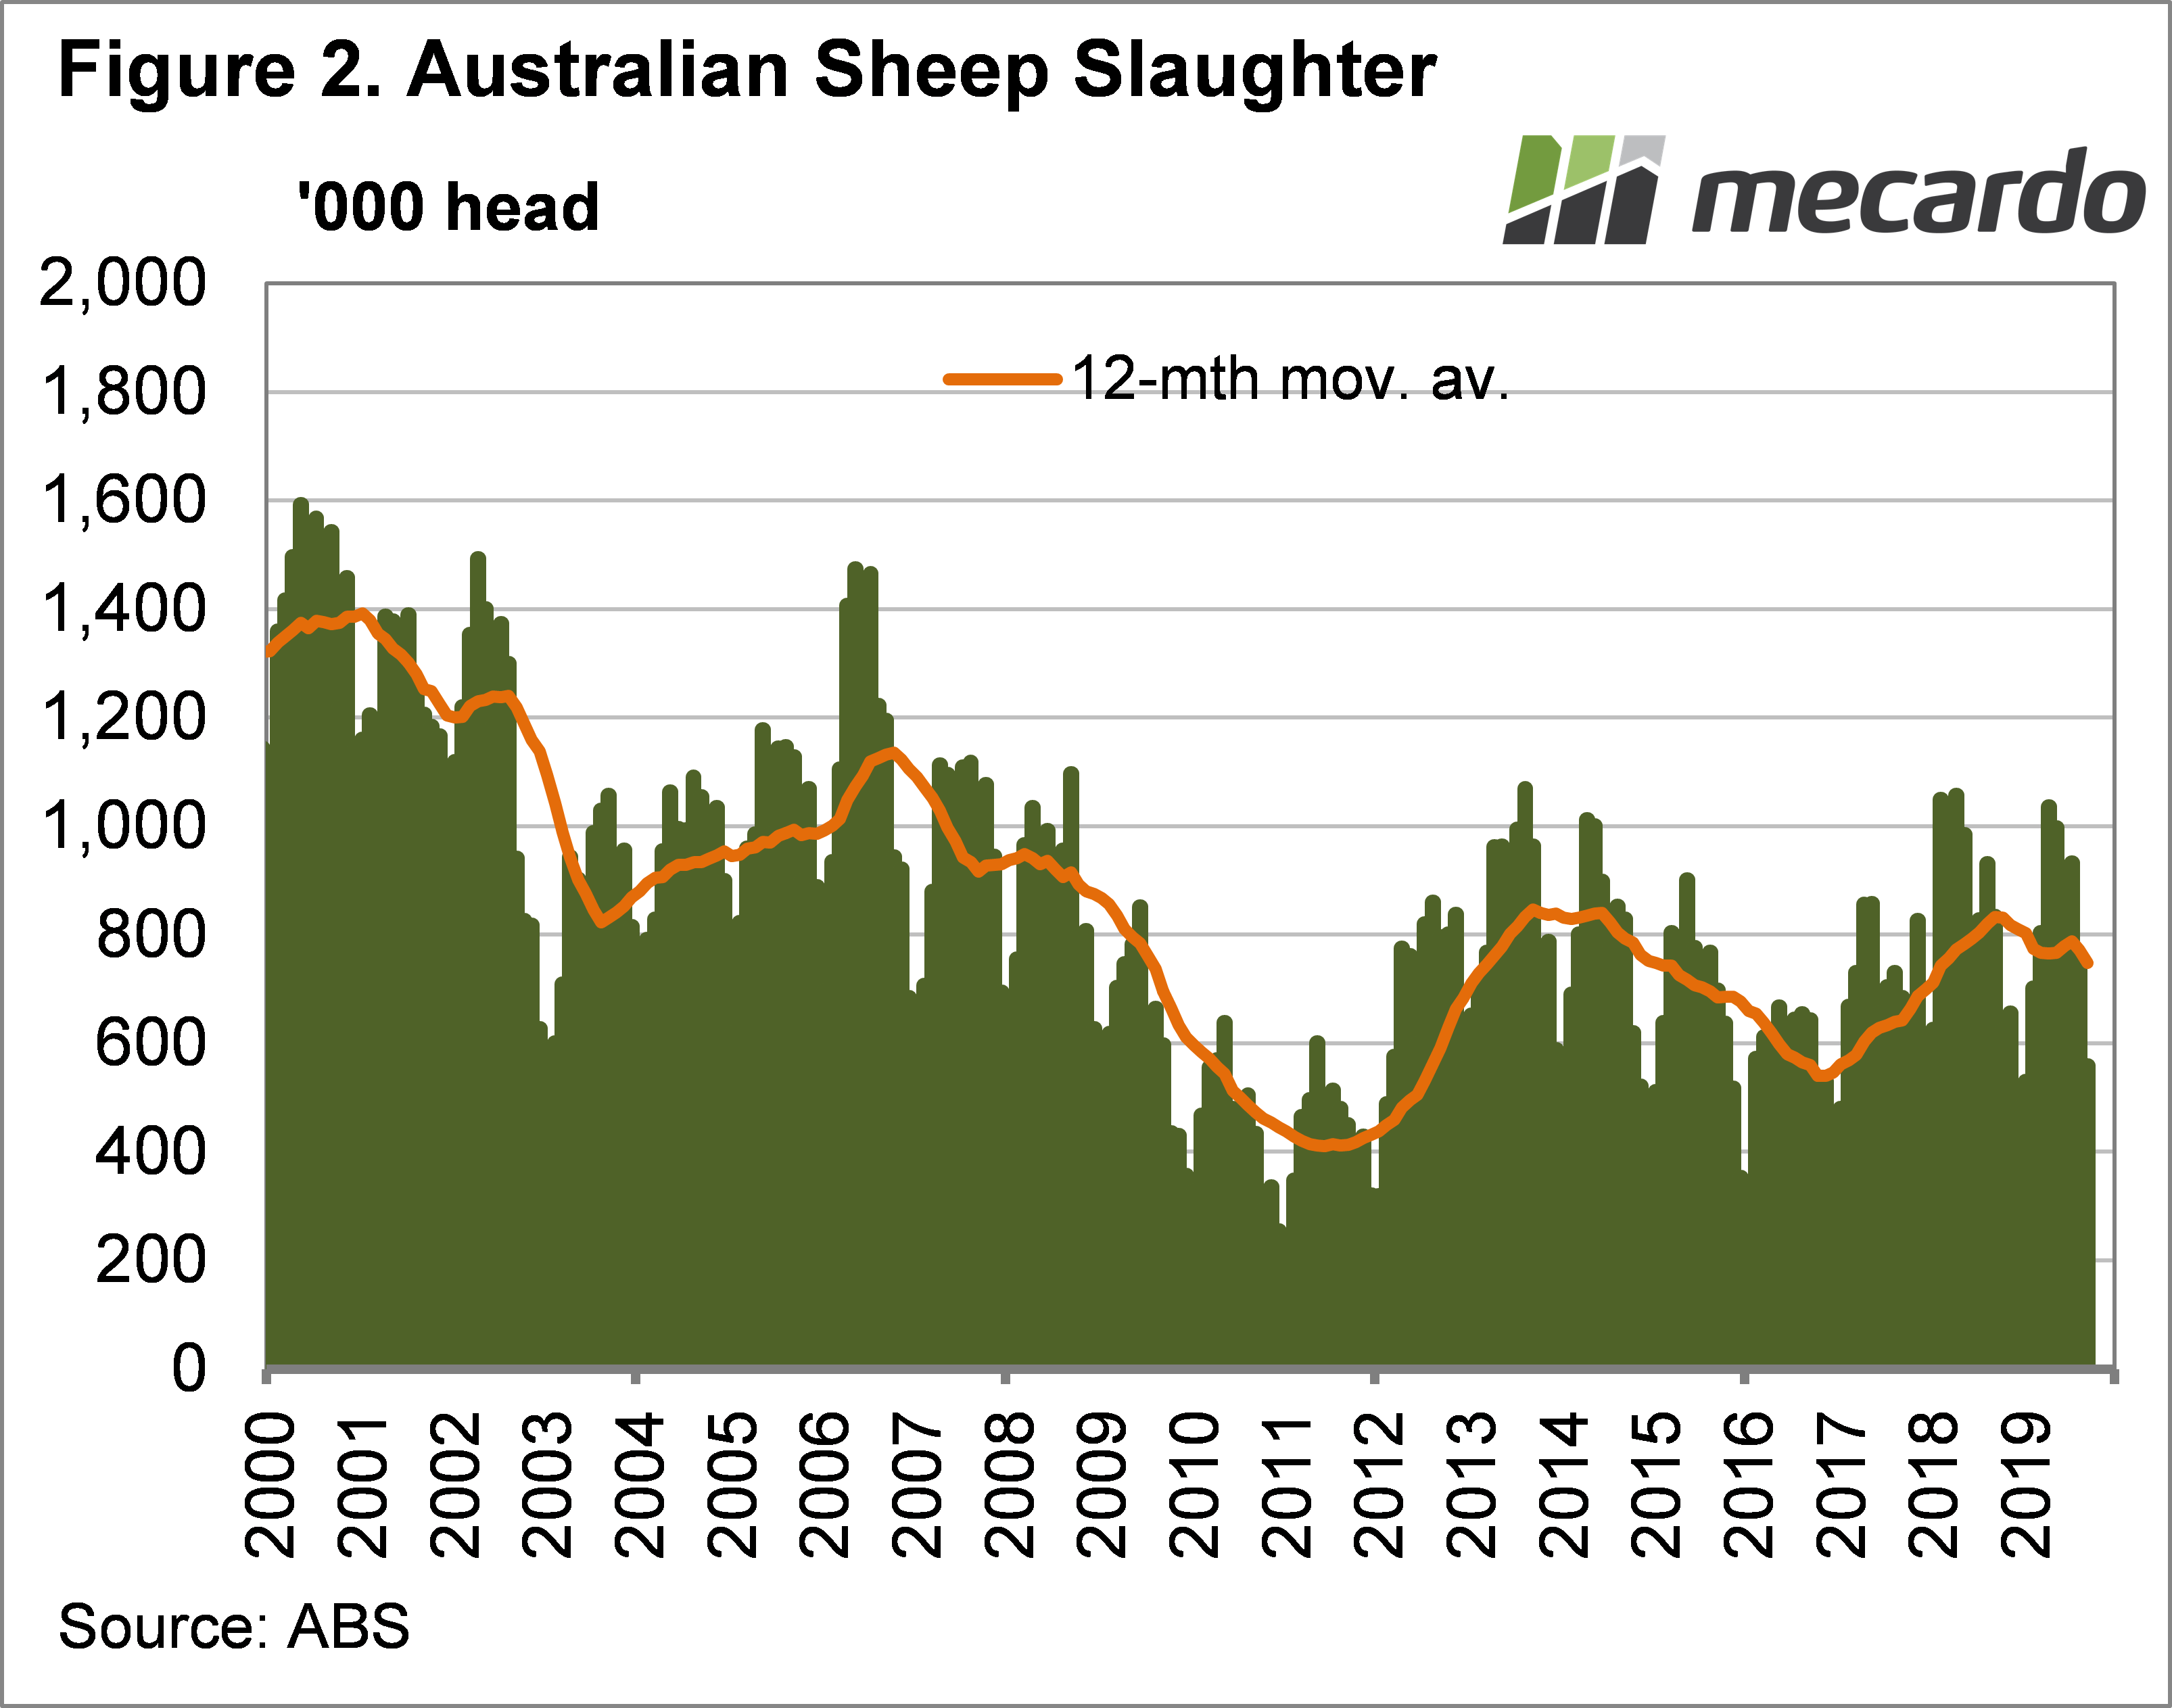
For sheep, the tightening supply was even more marked. March sheep slaughter was down 33% on 2019 and at its lowest March level since 2012. It is interesting to note however, that sheep supply for the last 12 months hasn’t been particularly low (Figure 3). The drought caused 2019 to be a high slaughter year and the last 12 months has seen total slaughter at close to 10 year highs.
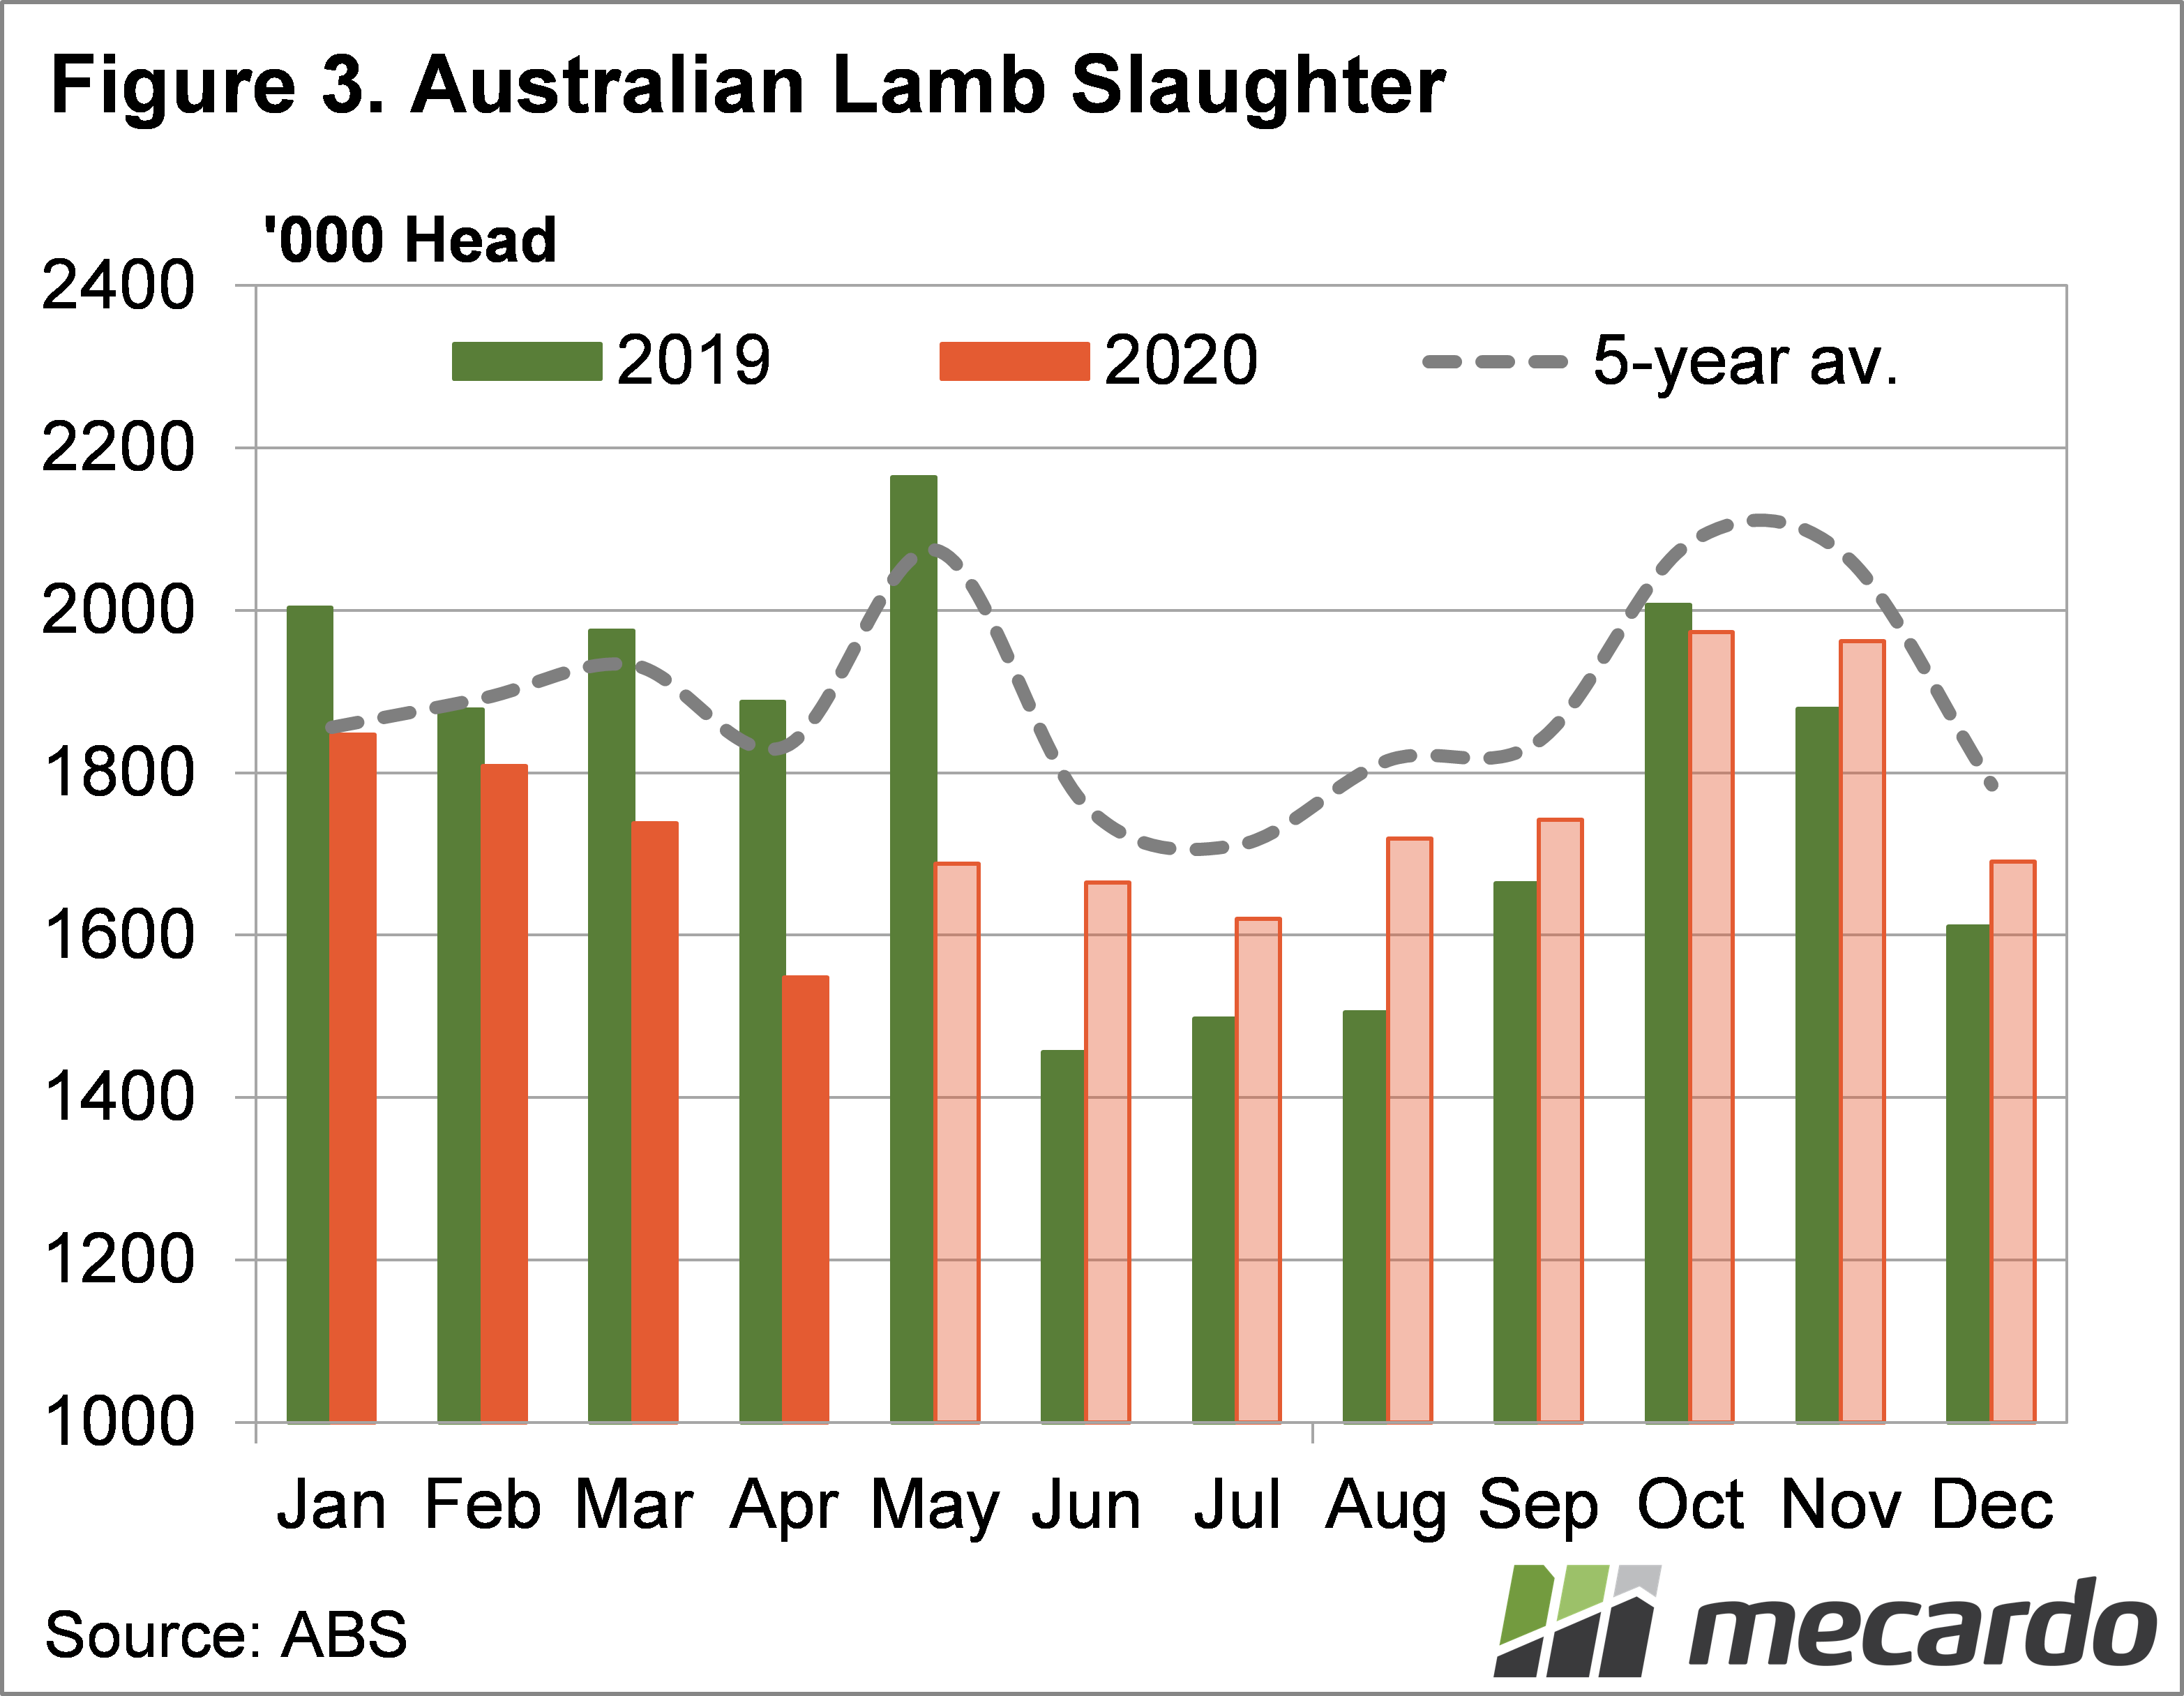
Looking forward, for lamb supply at least, the tight numbers of the first quarter, which look to have continued into April and May, has accounted for all of the fall in annual slaughter forecast by Meat & Livestock Australia (MLA).
Figure 3 shows how annual lamb slaughter will pan out if there is a total of 21 million and we deduct what has gone already. For the seven months from June, lamb slaughter will be 6.5% higher than last year.

What does it mean?
There has been a lot of talk about curves recently, but these curves are a bit different. The lamb slaughter curve looks like it might be close to the bottom now and be on its way up in the second half of the year.
Sheep slaughter is likely to be low for some time, dragging the 12 month rolling average lower, possibly towards 2016-17 levels.
Current low sheep slaughter is likely to be somewhat counteracted by stronger sheep slaughter in the coming year. We expect a narrow spread between lamb and mutton, but time will tell if it is through stronger mutton or weaker lamb. The way supply and demand are panning out, it might be the latter.
Have any questions or comments?
Key Points
- March lamb slaughter continued the downward supply trend but might be near the bottom.
- Sheep slaughter is low and may stay weak for some time.
- Supply trends will likely see lamb and mutton spreads narrow further later in the year.

Click on graph to expand
Click on graph to expand
Click on graph to expand
Data sources: MLA, Mecardo