It is a 1.56 billion dollar question because that is (very) roughly how much lamb producers made out of selling lambs for slaughter between August and December last year. The question is usually put more simply as ‘what are my lambs going to be worth in the spring?’
It is never easy forecasting prices, and when lamb supply and demand are both going through huge volatility is becomes more of a challenge. We have a reasonable idea of where supply is headed though and we’ll try and pin down demand to give an idea of price.
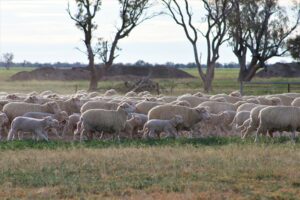
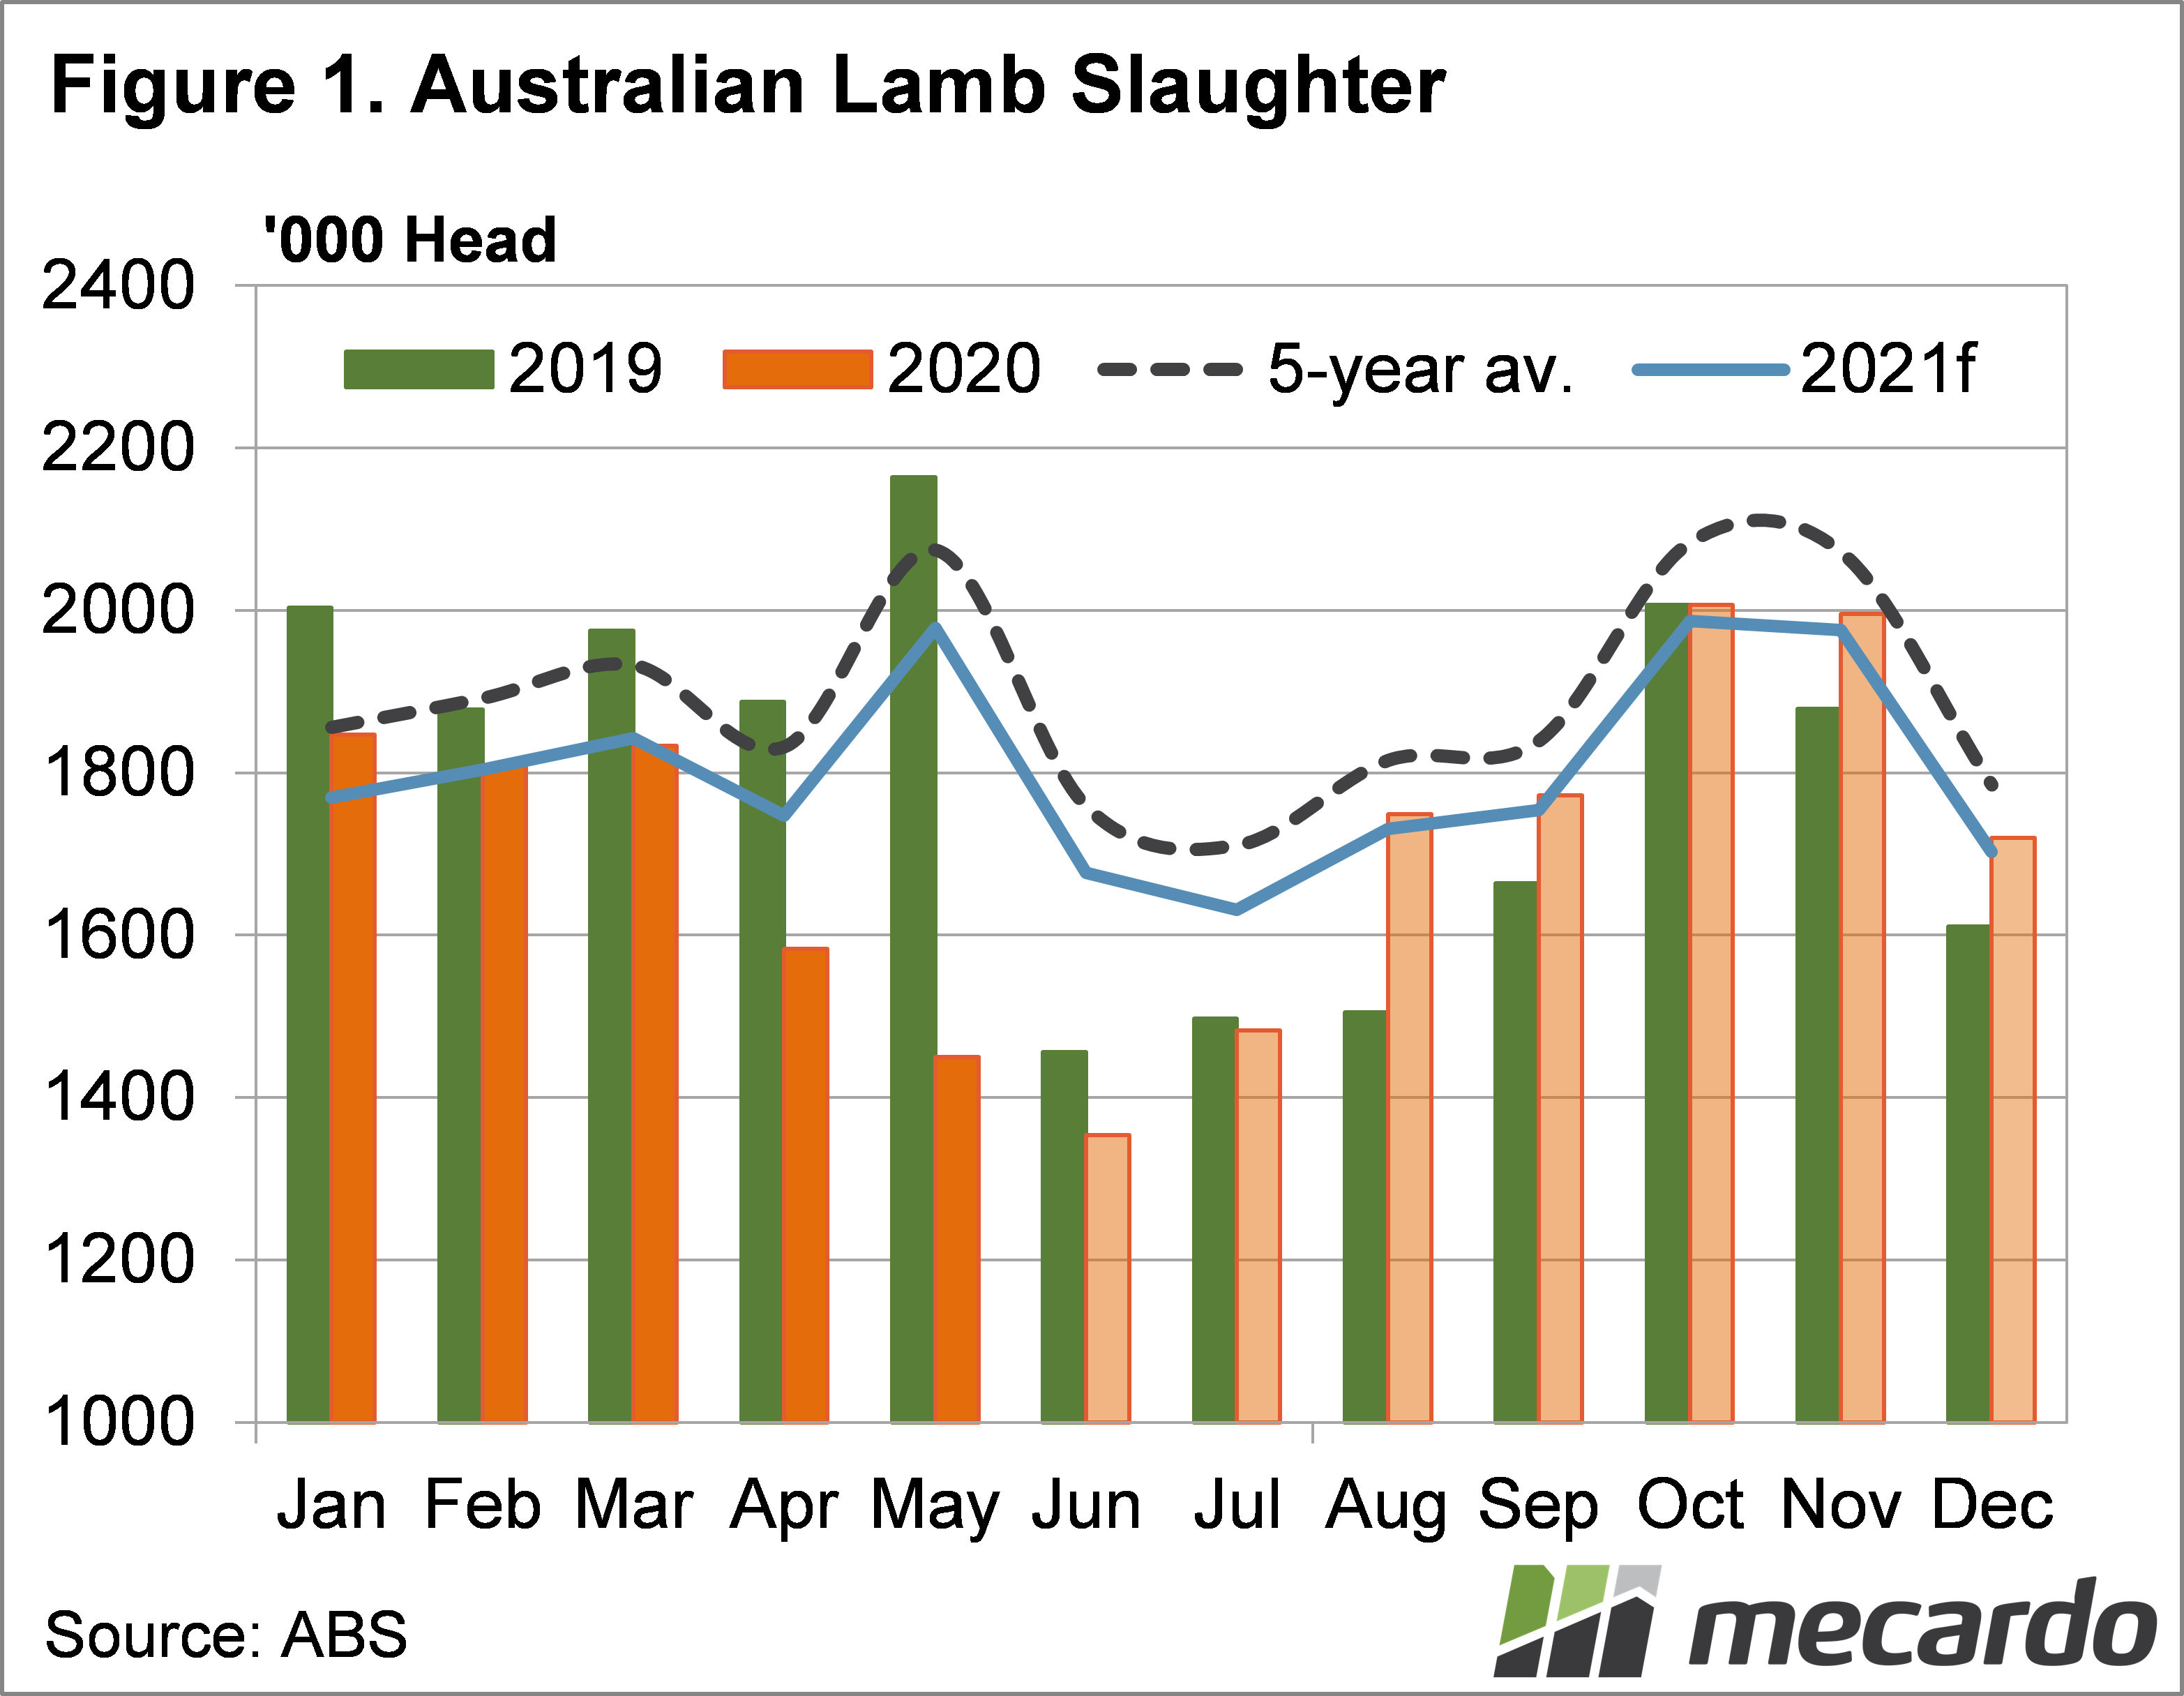
What we do know about supply is that it is likely to be stronger than last year in the spring. Scanning rates for winter and spring lambs were reportedly higher, and winter weather has been relatively benign so far, which should lead to higher survival numbers. Meat & Livestock Australia’s (MLA) annual slaughter fits with this, with such low winter slaughter feeding into higher forecast year on year levels in the spring (Figure 1).
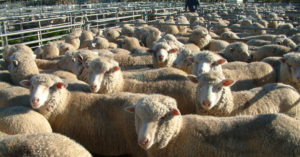
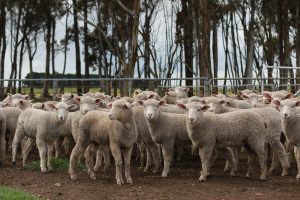
Higher slaughter rates for August might be something we see this year, that’s if plants currently closed due to COVID-19 infections are trading again. The much better autumn and winter should see more finished lambs coming out of NSW, which is where late winter supplies usually come from, figure 1 shows where august slaughter will be if normal supply seasonality returns.
The last time we looked at demand was back in April after it had fallen due to COVID. There is some argument to say it should be a bit stronger now, with some foodservice demand returning in most of Australia and some export markets. We can’t use data from July with processor shutdowns severely altering dynamics, so we’ll look at June.
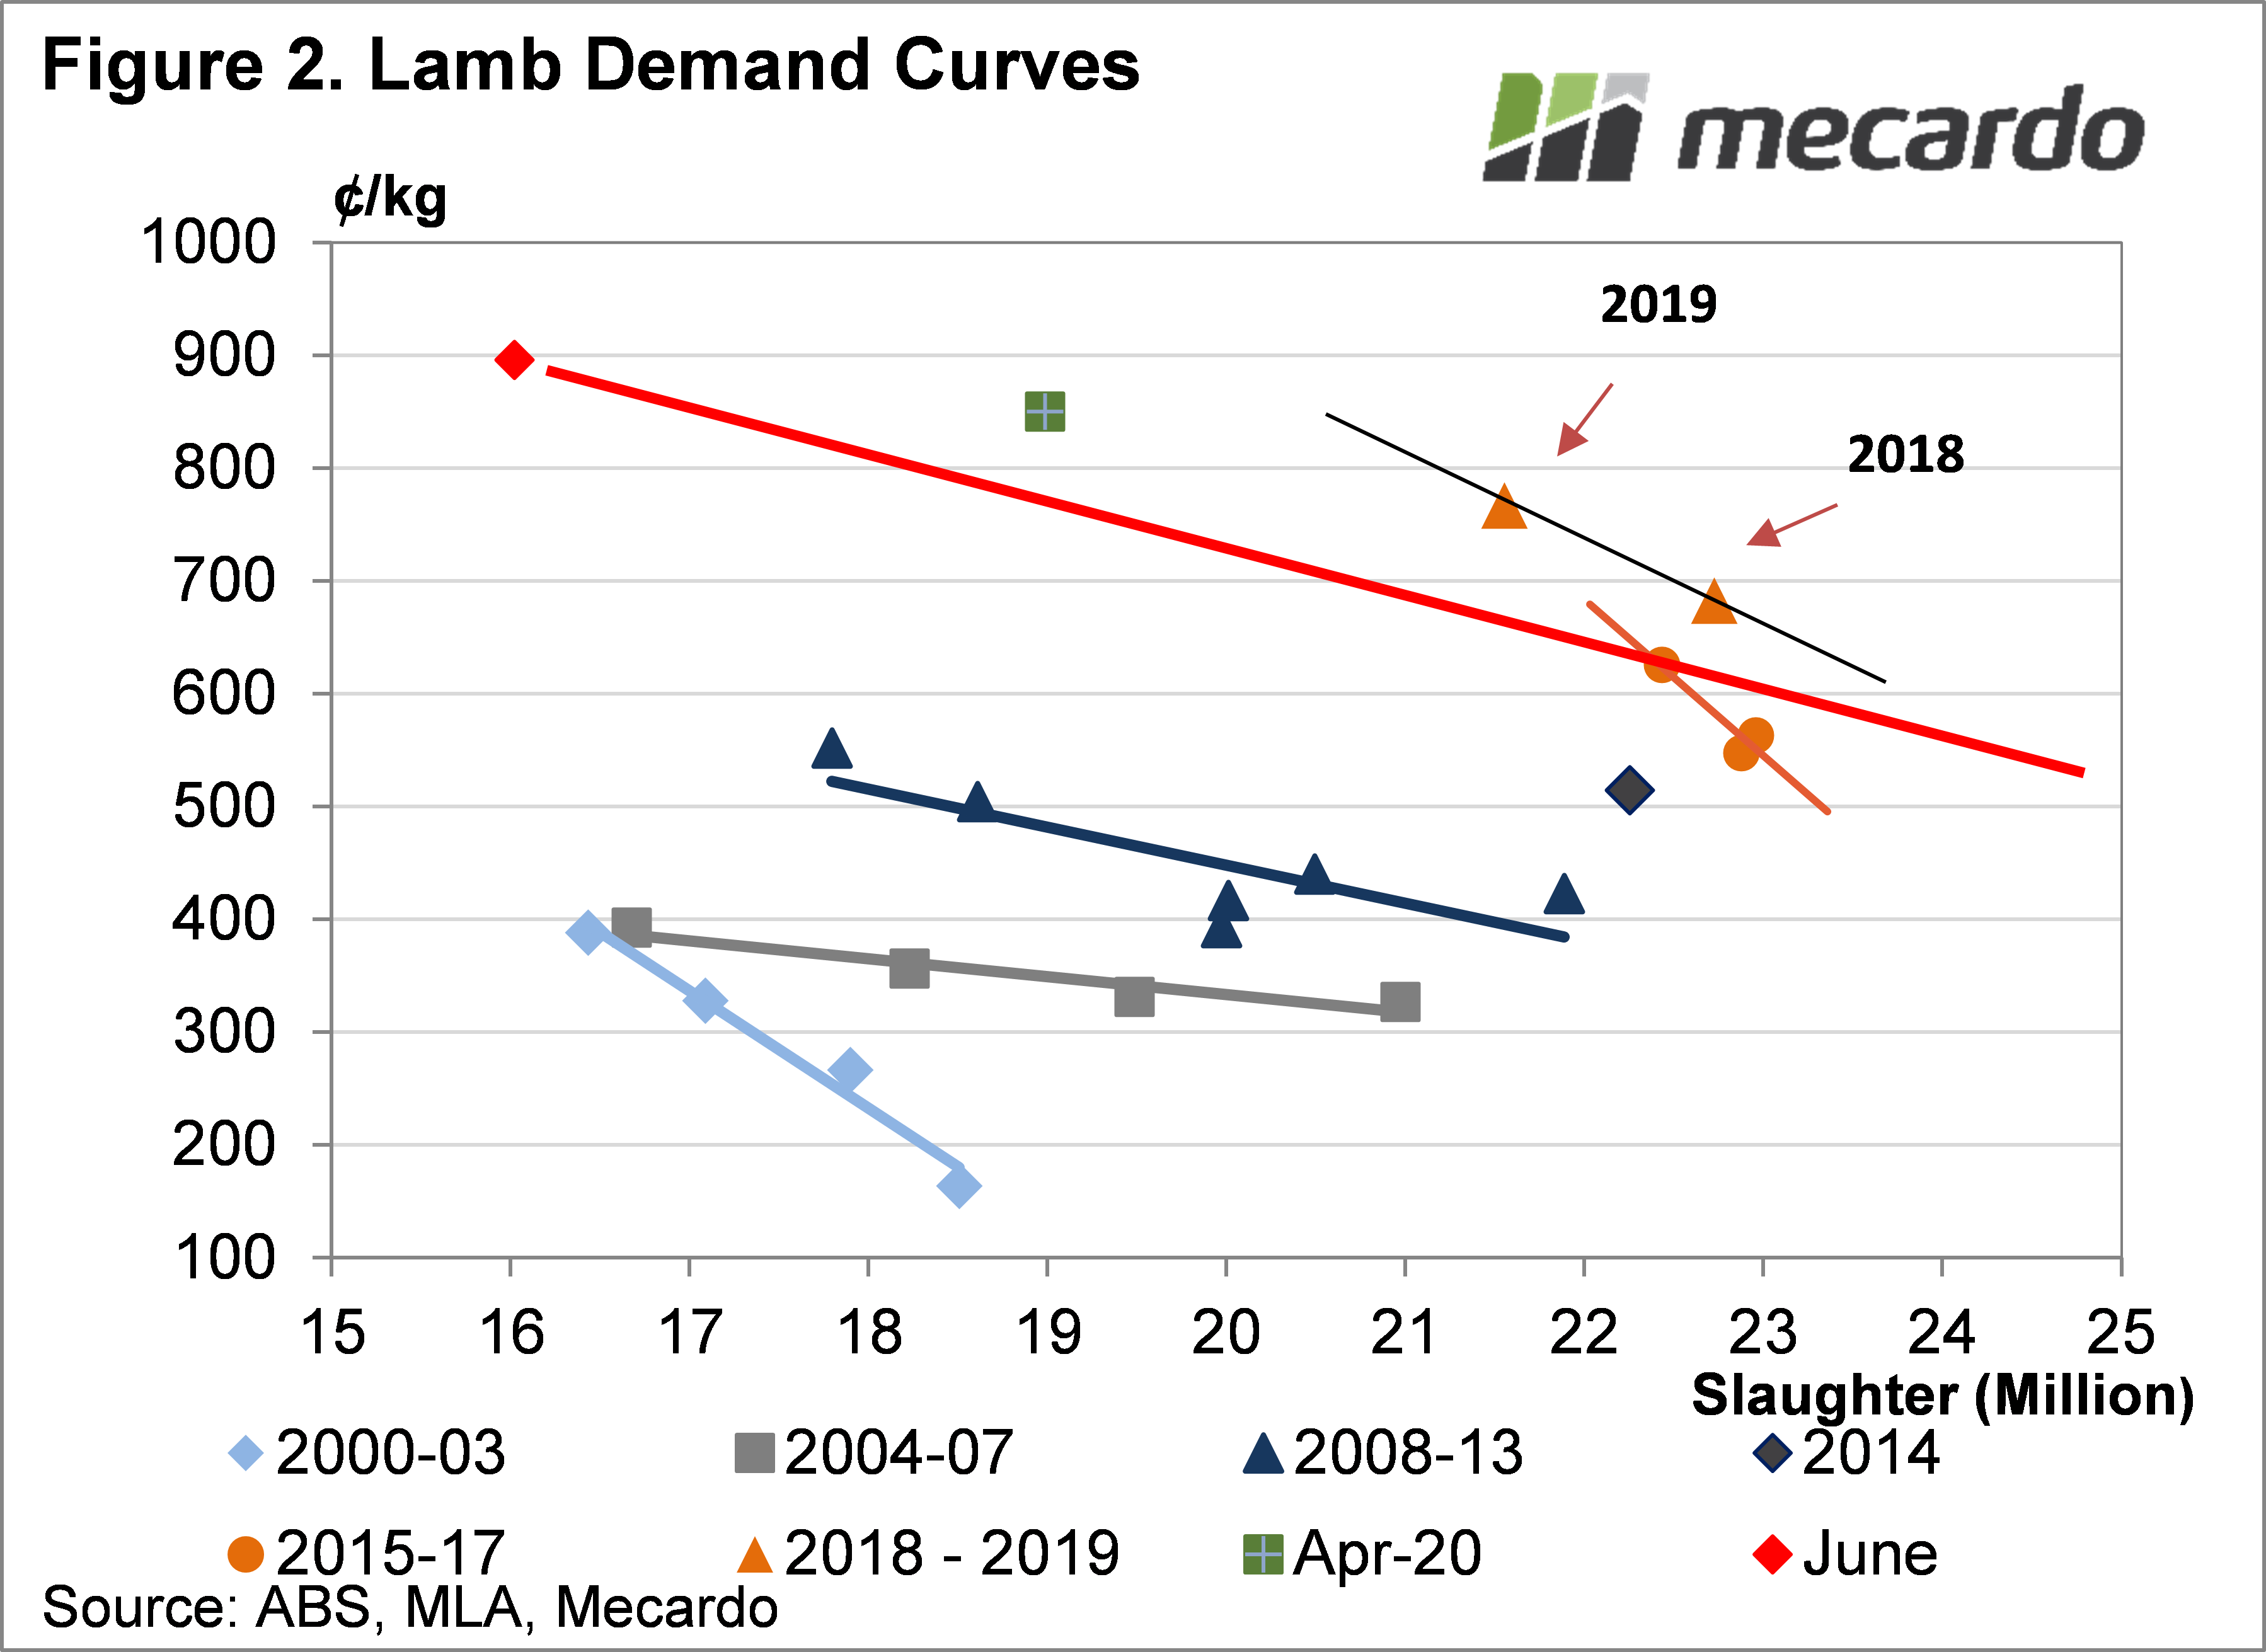
Regular readers will be familiar with the Lamb Demand Curve chart shown in figure 2. Lamb prices were good in June, but supply was extremely low, and this gives us the red marker. Where prices go when supply ramps up, depends on the elasticity of demand. The elasticity of demand is a measure of how much more buyers are willing to buy at lower prices, and how many more sellers are willing to sell at lower prices.
The April point suggests that up to the equivalent of 19-20 million head slaughter (1.5-1.6 million per month) prices should remain relatively strong, if all processors are again active. The forecast for August and September slaughter is 1.75-1.78 million head, which is equivalent of 21-21.5 million head per annum. For October and November, the equivalent annual slaughter level (monthly slaughter multiplied by 12 to give an annual rate) is 24 million head.

What does it mean?
Spring prices all depend on the slope of the demand curve, which in turn depends on where processors start to make reasonable margins. If better margins kick in at 700¢/kg cwt processor will ramp up capacity and the curve will be relatively flat.
Supplies could still overwhelm capacity, especially if COVID closures are still in play. Given the uncertainty for processors in moving stock, we don’t expect big moves in capacity until prices are at what could these days be considered cheap, and under 600¢. This gives a slope on the demand curve something like the red line, with prices 600-700¢ in September and 550-650¢ in October and November.
Have any questions or comments?
Key Points
- It is increasingly looking like new season lamb supply is going to be stronger this year.
- Demand is hard to pinpoint at the moment, but it looks to be weaker than last year.
- Lamb prices are likely to be 10-25% lower than last year in the spring.
Click on graph to expand
Click on graph to expand
Data sources: ABS, MLA, Mecardo