
The mythology of the wool industry tends to focus on sheep stations but the reality is that these large farms account for a small proportion of production, albeit an outsized proportion for the actual number of large farms. This article takes a look at the profile of the Australian flock.
ABARES regularly survey Australian agriculture with data available online at the AgSurf webpage. The data used for this article is drawn from the AgSurf database and refers to the 2019-20 year.
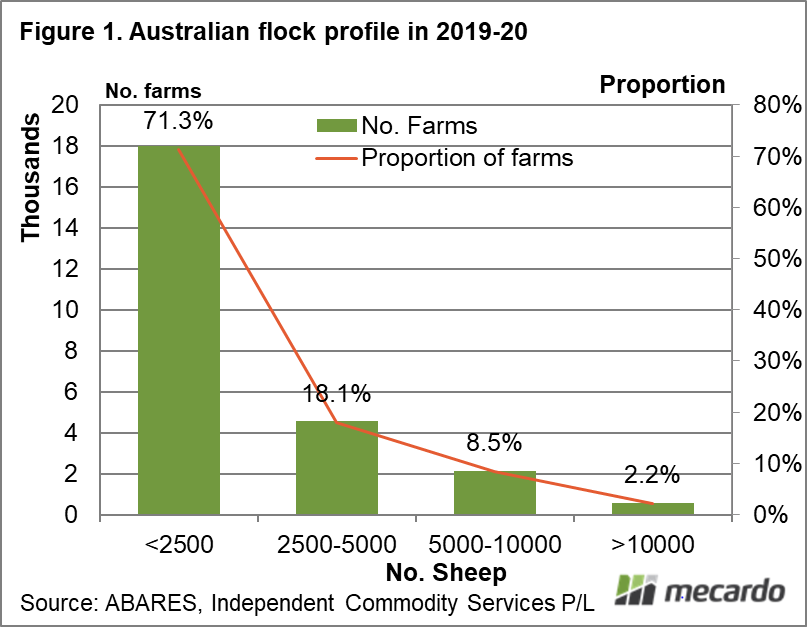
When looking at the Australian flock profile ABARES split the flock into four sizes in terms of sheep numbers; less than 2500, 2500-5000, 5000-10000 and greater than 10000. They do provide data on sheep enterprises with receipts split into deciles which is more detailed in terms of the profile but limited in terms of physical farm data per decile. Table 1 shows the ABARES estimation of farms per flock size, totalling 25,252 farms.
Figure 1 is a schematic taken from the data in Table 1 showing the numbers of farms for the four ranges of flock size used by ABARES and the proportion of farms within each range. The smallest flock size (less than 2500 sheep) accounts for 18,013 flocks which is 71.3% of the flocks in the ABARES estimate. As the flocks size increases the proportion of flocks falls, so that the largest flock range used (greater than 10000 sheep) accounts for only 2.2% of flocks overall. Basically there are a lot of small sheep flocks in Australia, and relatively few sheep stations, as exists in the wool industry mythology.
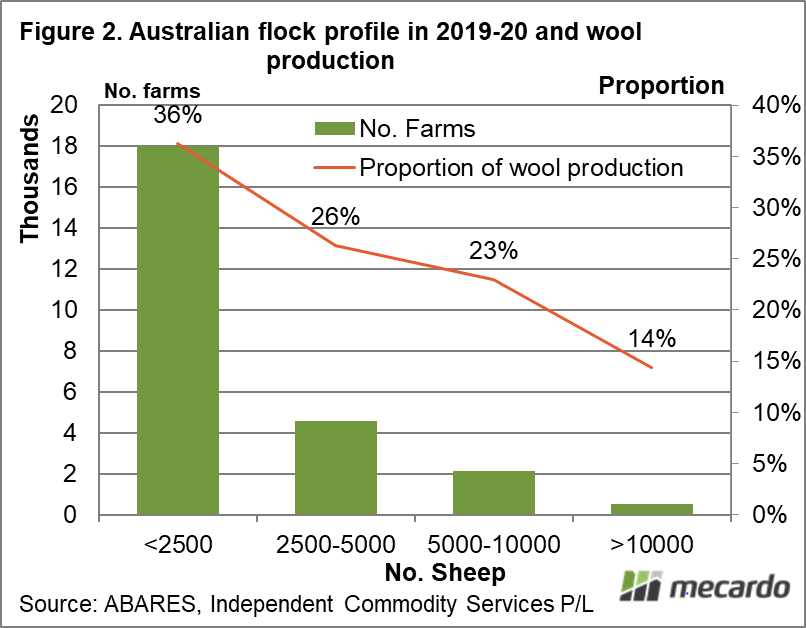
In Figure 2 the share of wool production (which is also very close to the share of sheep numbers) is shown for each of the four flock ranges. The smallest flock size (less than 2500 sheep) accounts for 71.3% of flocks but a smaller 36% of wool production. At the other end of the scale the largest category (greater than 10000 sheep) accounts for 2.2% of flocks but 14% of production. When combined, the two largest flock categories together show that the top 10.7% of the Australian flock in size accounts for 37% of production.
What about the wool clip size? In Table 1 the average wool clip size and flock size is provided for each range of flock size with the overall Australian average shown also. The average estimated clip size in Australia is 61 farm bales, with the average flock size 2423 sheep. The smallest category of flock (less than 2500) has an average clip of 31 bales and flock of 1220 sheep. The combination of the two largest flock groupings (greater than 5000 sheep) which account for 37% of production have an average wool clip of 214 farm bales and an average flock of 8572 sheep.

What does it mean?
The Australian flock in statistical terms has a big tail of smaller producers, accounting for a little over one third of sheep numbers. This means they are a meaningful proportion of the industry. The small size though also means that resources are limited for these farms, either because of size or because they are a minor enterprise in a larger farm business. Fostering change which requires investment (such as investment in shearing apparatus of some type) will be a challenge for the lesser resourced flocks.
Have any questions or comments?

Key Points
- The top 10.7% of wool flocks by size account for 37% of wool production and sheep numbers.
- The bottom 71.3% of flocks by size account for 36% of wool production and sheep numbers.
- The average wool clip in Australia is 61 farm bales and is drawn from a flock of 2,423 sheep.

Click on figure to expand
Click on figure to expand
Click on figure to expand
Data sources: ABARES, ICS


