This year many Australian farmers have been deeply impacted by El Niño. Although the current El Niño is still in play, the BOM have forecast that the El Niño will weaken over the coming months and there is currently an equal chance of a La Niña event developing. In this analysis we will examine how La Niña has impacted the Australian farmer.
According to the BOM, ‘El Niños often lead to drier conditions over large parts of Australia, while La Niñas tend to enhance rainfall over much of the continent’. However, it must be noted that not every drought is associated with El Niño nor every wet year with La Niña.
In this analysis we have examined the El Niño and La Niña events which have been considered moderate to strong from 1960 to 2015 in order to determine what impact these events have on grain crops by analysing the year on year change in wheat production.
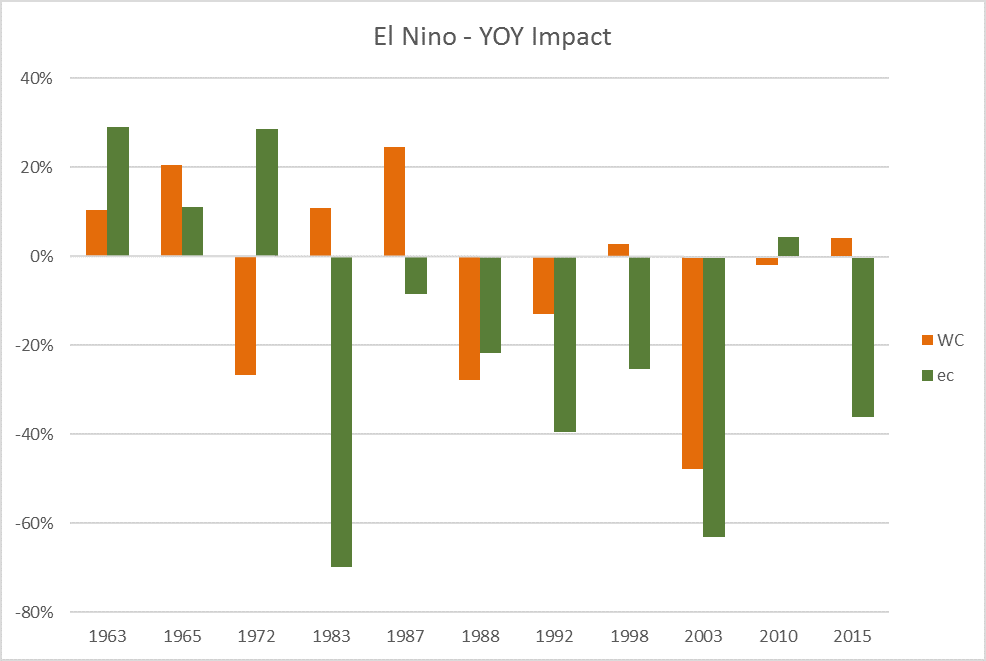
In figure 1, we see the year-on-year impact of El Niño split into east coast and west coast. In the period 1960-2015, 7 of 11 El Niño years have recorded a reduction, with 6 of these years recording a > 20% reduction. In Western Australia the impact of El Niño has been less negative, with 6 out 11 event years recording an increase. However, only two of these years record > 20% increase. In addition, during the years of production decline, 3 of these years recorded large production falls of > 20%.
The year-on-year impact of La Niña is displayed on both the east and west coasts as highlighted in figure 2. In the period 1960-2015, there have been 8 La Niña events. The east coast during these La Niña events experienced 6 years where production has been higher, with 4 being >15% and 2 events where production reduced by >20%. The impact of La Niña in WA has caused 4 out of 8 years to have a production contraction, with 3 of those years having a >20% decline. The La Niña years with an increase in production in WA have resulted in smaller increases than the east coast with the exception of 1988.
In both figure 1 & 2, it is evident that since the mid 1980’s in Australia El Niño events have overall been negative for crop production and La Niña events have been positive, with the exception of 2010 in WA.
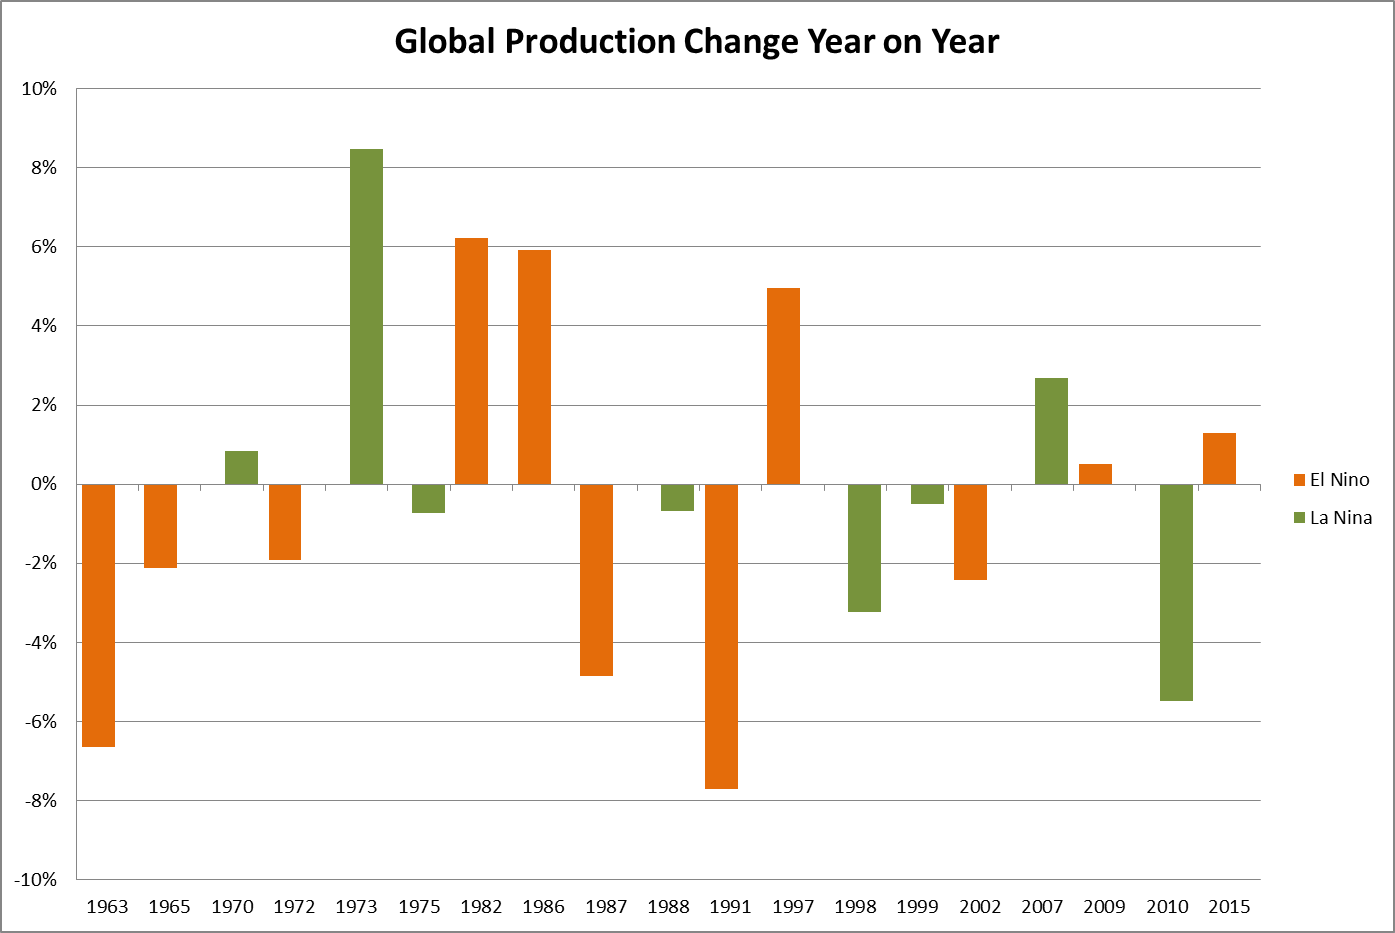
In figure 3, the year-on-year impact of La Niña & El Niño is detailed at a global level. During an El Niño year we can determine that production was reduced in 6 years out of 11, and increased in 5 years with no changes of more than 10% on a global level. During La Niña years, global production has increased in 3 out of 8 years, whilst production has decreased in 5 years.
At present, making marketing decisions based on La Niña would be daring as there is currently only an equal chance of La Niña occurring in 2016. In the event of La Niña, we could expect a reasonable chance of increased production on the east coast, equal chance of above or below production on the west coast, and at a global level an increased chance of lower production.
What does it mean?
At the moment it is too early to make marketing decisions based on La Niña, as there is still only an equal chance of an event occurring.
As the year progresses and a La Niña with traditional impact begins to become apparent, it would likely result in basis decreasing in Australia, and Chicago futures rising on the back of lower global production.
Have any questions or comments?
Key Points
- El Niño events tend to have a larger negative impact on east coast Australian production, with 6 out of 11 moderate to strong El Niño years recording >20% decrease.
- La Niña events tend to result in increased production on the east coast, especially in events since the mid 1970’s which may be due to more efficient water use.
- La Niña years in Western Australia tend to be more subdued with lower production gains, and a higher chance of reduced production.
Click on graph to expand
Click on graph to expand
Click on graph to expand
Data sources: ABS, USDA, BOM, Mecardo


