The Australian greasy wool market is transparent in large part to the market reporting efforts of AWEX. Indicators produced by AWEX, especially the Micron Price Guides (MPGs), are used by the industry generally both here and overseas as a guide to price movements and price levels. This article takes a look at the long term relationship between the average auction price and MPG for 19 micron.
ABARES, in the annual Commodity Statistics publication, use micron price guides to provide historical price levels. The implicit assumption by ABARES is that the MPGs represent a consistent value of wool to sellers in the market. During the past two decades discounts for short staple and low staple strength wool have shrunk, so that wool which would have been heavily discounted in the late 1990s now receives a moderate or even mild discount. From the perspective of wool sellers in the market it is the average price received which is important, not the top price, or price for the better fleece types which tend to get all of the attention.
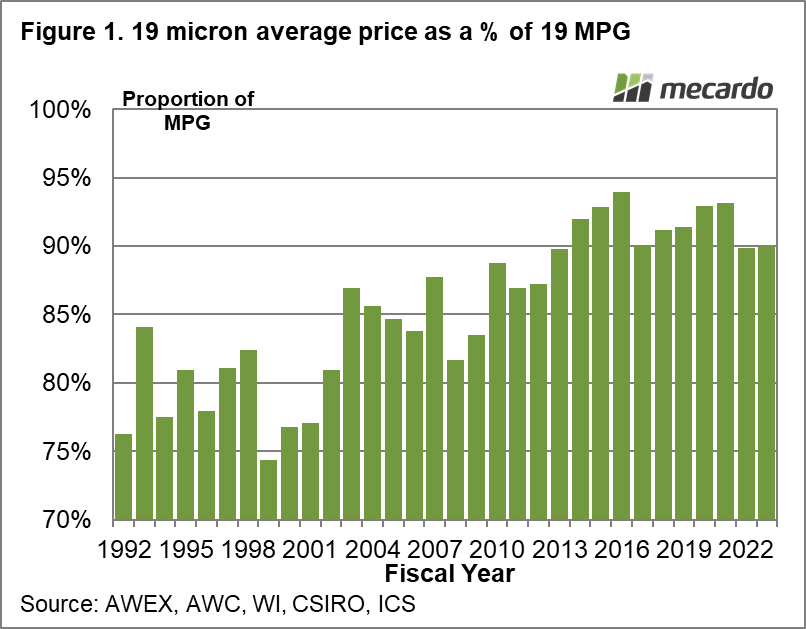
Figure 1 shows the average price per kg for 19 micron wool sold by season, as a percentage of the average eastern 19 MPG/indicator from 1991-92 until this season (2022-23). During the 1990s the average price received at auction for 19 micron wool averaged 79% of the 19 micron indicator, reflecting the larger discounts at the time for wool with poorer specifications. From 2013 onwards the average 19 micron price received at auction has averaged 92% of the indicator.
If the MPG is used as a guide to wool prices received it would over estimate prices received in the 1990s by 26%, and for the market during the past decade by 8%. If a more realistic adjustment to the MPG is made and the average price is assumed to be 92% of the MPG, estimated prices during the past decade would be close to actual, but they would still over estimate average prices received in the 1990s by 16%. The lesson here is that unadjusted MPGs/micron indicators are not an accurate reflection of average prices being paid at auction.
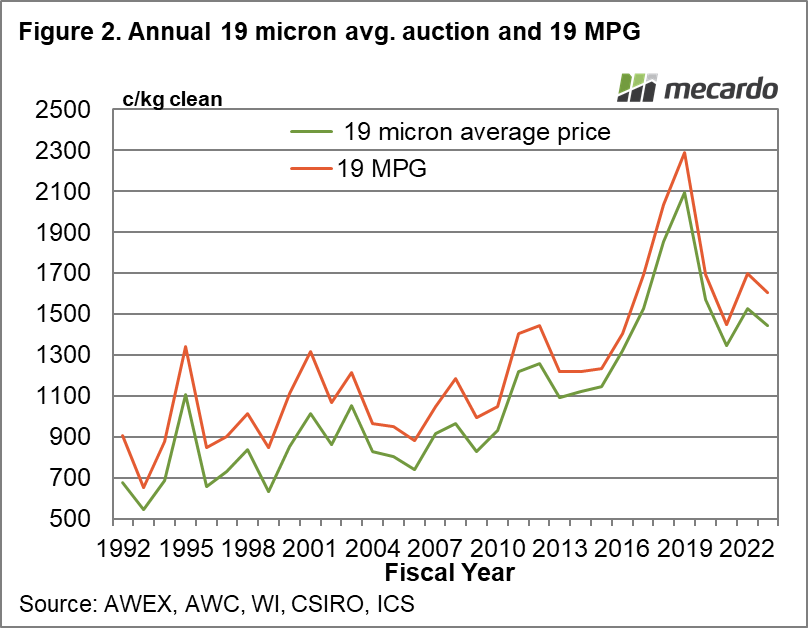
Figure 2 shows the annual price series from 1991-92 onwards for the 19 MPG/indicator and the average 19 micron price received at auction, in nominal terms. As Figure 1 shows, the gap between the two series narrows from the late 1990s through to around 2013.
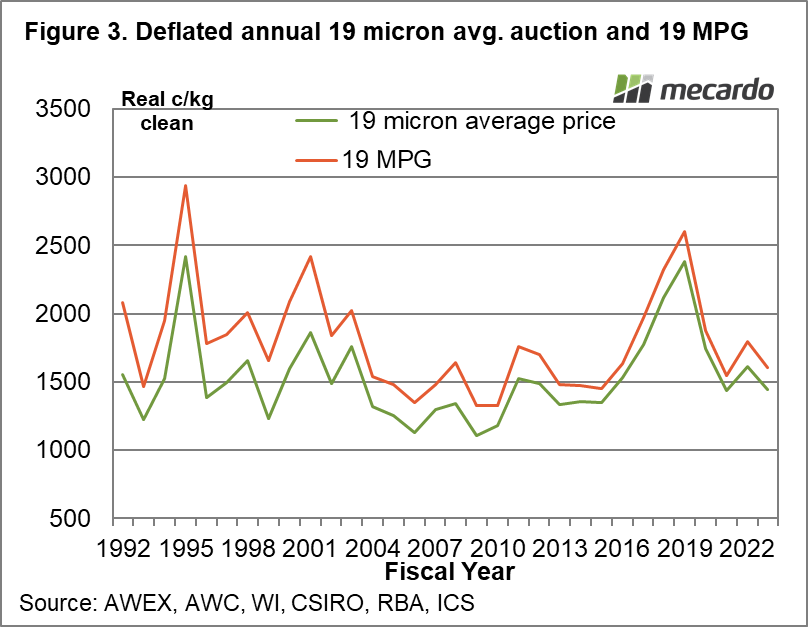
In Figure 3 the same price series are shown in deflated (adjusted for inflation) terms. The average price peak in 2018 becomes more impressive when viewed from the average price received (recall that low staple strength was hardly discounted at all during that period). The 1990s prices are pulled down by the average price series, especially the boom 2000-2002.

What does it mean?
Micron indicators are used generally as a measure of wool prices (specific to micron categories) through time. This article shows this practice needs to adjust those indicators to better reflect average prices received at auction by sellers. It over estimates the prices present in the period prior to 2013 by a large margin.
Have any questions or comments?

Key Points
- The average price received at auction for 19 micron wool has risen from 79% of the 19 micron indicator/MPG in the 1990s to 92% during the past decade.
- This change in basis means that the 19 MPG over estimates the average price received by sellers during the 1990s.
- It is also a timely reminder to adjust the 19 MPG in order to estimate average prices received at auction (a ratio of 0.92 is a good start for the greasy wool market now).
Click on figure to expand
Click on figure to expand
Data sources: AWEX, ICS