
Recent Mecardo articles have reinforced the point that wool prices tend to “run with the apparel textile fibres pack of prices”, which means wool fortunes are tied to the greater fortunes of the apparel industry. There is room within this structure for fibre prices to move in relation to one another even if they are tied to common cycles and trends. This article takes a look at Merino prices in relation to cotton.
In the 1980s and 1990s when 21-22 micron was the average Merino fibre diameter, the benchmark price ratio for wool to cotton was three. A wool price which was three times that of cotton was seen as sustainable. This relationship has changed greatly during the past 20 years.
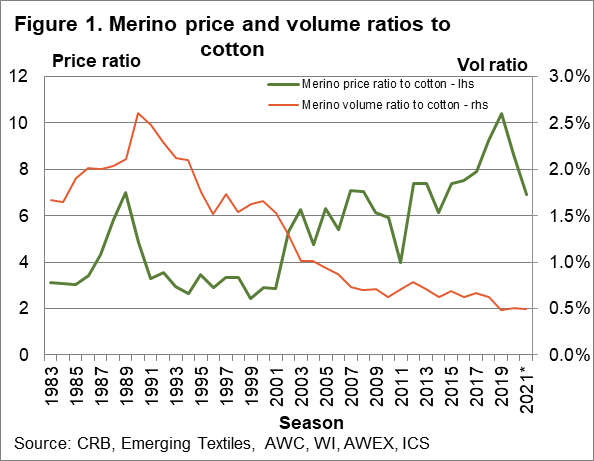
In Figure 1 the average Merino micron price ratio to a cotton price series is shown from the early 1980s by season, to this month (so the 2020-21 season at this stage is based on the first week only). The second line shown in Figure 1 is the ratio of Australian Merino volumes to worldwide cotton consumption. This is only a rough and ready comparison of volume as there are other producers of Merino wool in the world and it may be possible to narrow the cotton specifications. However, such changes to the data are unlikely to change the bigger picture shown in Figure 1 which is of a declining relative volume from 1990 onwards.
The price ratio peaked above 6 in the late 1980s wool cycle, before falling back to around three as prices were weighed down in the 1990s by excess greasy wool stocks. Falling production pushed the volume ratio lower after 2000, although it steadied up around 2010 before falling again in the past couple of seasons under pressure from drought. The price ratio has followed the opposite path. After 2001, with the official greasy stockpile liquidated and production still under pressure the price ratio lifted at first to around six, for approximately a decade before falling heavily in 2010-2011 when cotton prices had a stellar run up. After 2010-2011 it started trending higher again, peaking 2018. As of last week, the price ratio was back down to around 6.9.
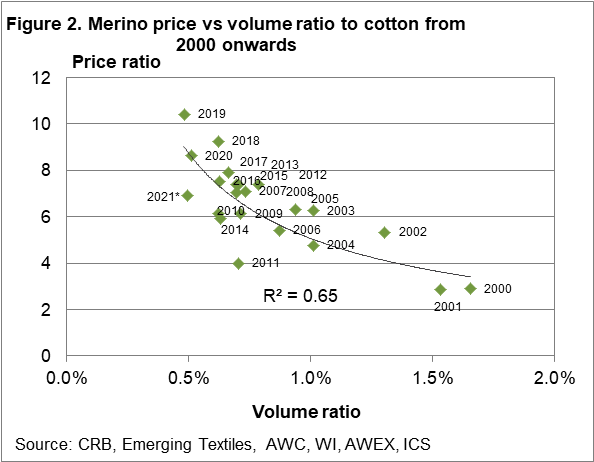
Figure 2 compares directly the price and volume ratios from 2000 onwards. The falling volume ratio accounts for around two-thirds of the increase in the price ratio, using some basic regression analysis. The trend line in Figure 2 indicates a price ratio in the range of 8 to 9 as the sustainable level given the current volume ratio. The current price ratio of 6.9 is below this level.

What does it mean?
In 2008-2009, during the GFC, the Merino price ratio to cotton fell from around 7 to 6. The pattern this time around is clouded by a pandemic downturn being compounded on top of an existing down cycle. In the long run, the price ratio will recover with a target level of 8 to 9, once the pandemic is brought under control.
Have any questions or comments?
Key Points
- Using common benchmark cotton indicators, in this case, the spot New York futures quote, the sustainable Merino price ratio to cotton is in the region of 8 to 9.
- The wool price ratio has trended higher during the past two decades as the relative volume of Merino wool to cotton has fallen.
- For the curious, it is a similar story for the 21 micron price ratio to cotton.
Click on graph to expand
Click on graph to expand
Data sources: CRB, Emerging Textiles, AWX, WI, AWEX, ICS


