
This article takes a look at the New Zealand merino clip from last season. While Australia accounts for three quarters of international merino production, the Kiwi merino clip more than holds its own for the more valuable parts of the merino supply
Mecardo looked at the New Zealand merino clip in August 2021. With the shrinkage in Australian merino production since the 1990s, the swing finer in merino production, and now the rise of large premiums for certified integrity schemes such as RWS, smaller merino producers such as New Zealand have increased in importance. There tends to be a thread of competition in Australian discourse about other merino producers when we really need to co-operate given the size of the industry and the challenges facing it.
As usual the New Zealand data is estimated from a range of sources including export data from Beef+Lamb NZ , graphical details of the component of the merino clip tested by the New Zealand Wool Testing Authority (NZWTA) and data from New Zealand wool sold in Melbourne. As the micron distribution of the New Zealand merino clip is an estimate, any errors are the writers and nothing to do with the suppliers of data.
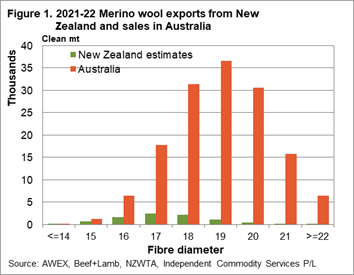
Figure 1 is the simple comparison by volume by micron of the New Zealand and Australian merino clips. For Australian volumes auction sales data has been used. As stated in earlier articles the New Zealand clip should really be thought of as the eastern “New England” region in terms of volume, micron, staple strength, vegetable matter and yield, so a direct comparison to the entire Australian merino clip is unfair.
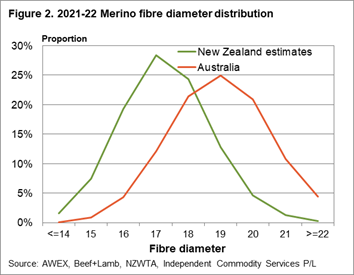
Figure 2 compares the micron distribution of the two clips, showing the New Zealand clip to be some 2 microns finer than the overall Australian merino clip. It is also one half to a micron finer than the two finest regional merino clips in Australia, which are the Northern Tablelands in NSW (including Traprock in south-eastern Queensland) and Tasmania.
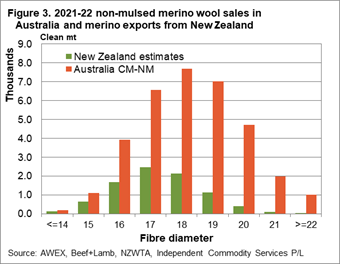
In Figure 3 the Australian volume has been limited to merino wool accredited as CM-NM. On the very fine end (15 micron and finer) the New Zealand volumes are on par with Australia in this comparison. For the broader micron categories Australian volumes are multiples of the New Zealand volumes.
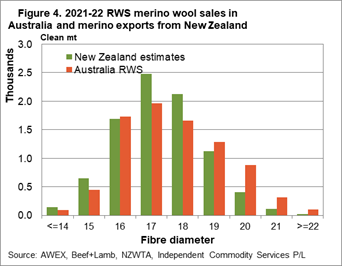
An even narrower focus is used in Figure 4 where the Australian merino volumes are filtered for RWS accreditation. It is assumed that all of the New Zealand merino clip is RWS (or equivalent) accredited. Figure 4 shows the Australian RWS and New Zealand merino clips are on par in terms of volume, and have a similar micron distribution.

What does it mean?
To understand the influence of supply on wool prices we need to understand the supply of merino wool from other countries. As an industry we need to look at merino production and supply as the supply chain does, an overall supply coming from a range of geographic regions, one of which is Australia. In terms of RWS accredited merino wool, the New Zealand merino clip is of comparable size to the Australian supply, even if it is only 6% of the total Australian merino auction sales.
Have any questions or comments?

Key Points
- The New Zealand merino clip is approximately 6% of the size of the Australian merino clip (in clean terms) with an average fibre diameter some 2 microns finer.
- In terms of CM-NM merino wool, the New Zealand clip is a quarter the size of Australian supply from last season.
- In terms of RWS accredited wool, the New Zealand merino clip matches the Australian merino RWS supply from last season.
Click on figure to expand
Click on figure to expand
Click on figure to expand
Data sources: Cotlook, Emerging Textiles, RBA, AWC, WI, AWEX, ICS , Mecardo


