Global trade and commerce are again being compromised by political instability. The Hamas-led atrocities on the 7th October inside Israel have precipitated a wider conflict in the Middle East which is threatening to spill outside of the region.
The region in question is the world’s most important trading route, carrying goods and commodities from oil and gas to raw foods to some of the most food-insecure countries in the world. The Red Sea is a vital maritime corridor linking the Mediterranean via the Suez Canal. Yemen-based Houthi rebels are patrolling the Red Sea and targeting Western-owned bulk vessels.
As a result, the insurance rates for bulk vessels travelling through the region have increased exponentially and can now add as much as US$1M per ship per transit. Some insurers are already seeking to exclude US/UK flagged vessels from Red Sea cover. The alternative is to pass around the Cape of Good Hope adding between 7 to 15 days extra transit.
Major shipping lines including Maersk and oil giant BP have ceased using the sea route citing increased risk. The share of ships using the longer route coming from the EU, Russia and Ukraine has increased to 42% from 8% last month.
According to Bloomberg, major LNG supplier Qatar has also stopped using the route. Moving the fuel from Qatar to the UK via southern Africa takes about 27 days, compared with 18 through the Suez Canal. While the longer LNG journeys will tie up tankers and boost freight costs, they’re not expected to lead to shortages. Alternative sources of LNG including Australia and the US are keeping the spot market well supplied.
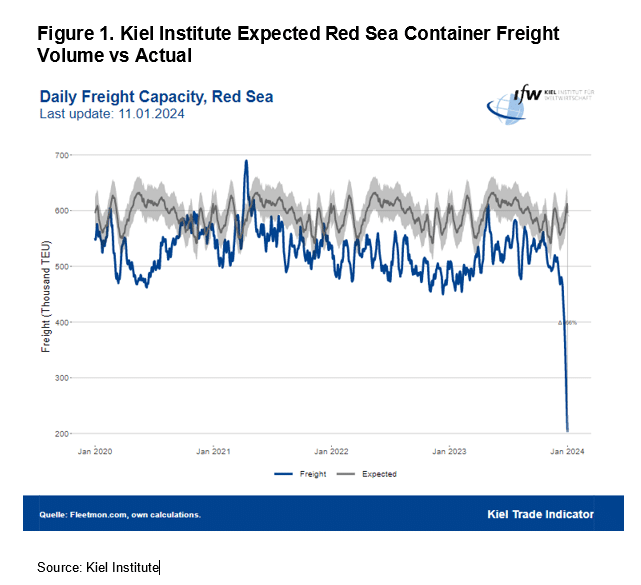
Per Kiel Institute for the World Economy, the volumes of container ships using the Red Sea corridor have plummeted 66% below expected freight volumes so far in January 2024 after being down 27% in December 2023 (Figure 1).
The threat to Australian trade is not negligible. The ABS states that 72% of Australian urea is sourced from Middle East countries and 42% of the phosphate from Jordan and Morocco in 2023. The proportion of phosphate sourced from these countries is expected to be higher in 2024 due to Chinese export restrictions. Last week a US-flagged ship carrying phosphate was hit by a drone causing a fire. Both ship and crew were unharmed and continued their passage, however, it is causing a rethink on the safest route.
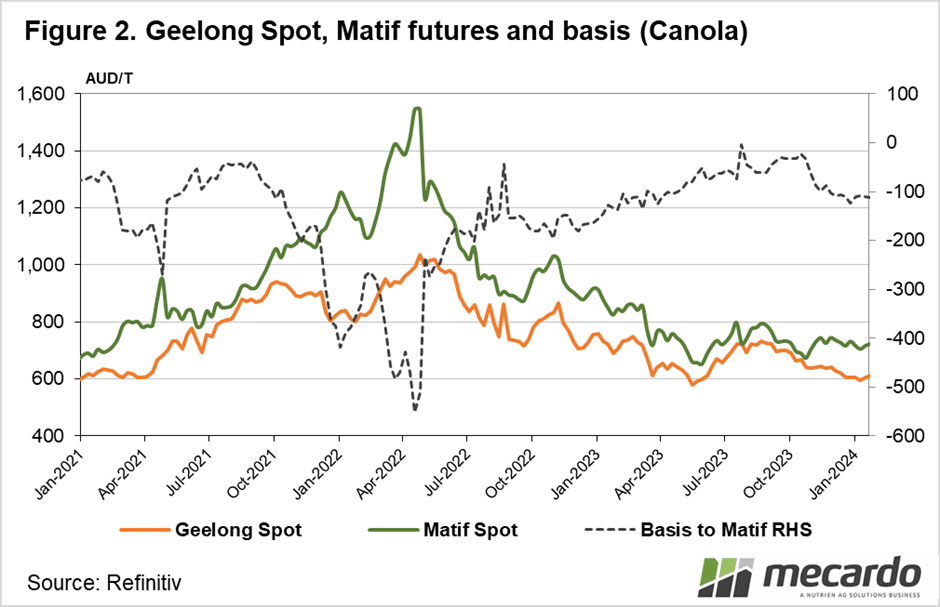
The export of canola to Europe may be impacted should the carrier choose to go the long way around. A Rabobank report recently suggested that the “additional distance and time adds up to US$1 million/voyage for a bulk carrier, which is equal to AU$25/tonne for Canola assuming a 60kmt vessel”. Before the initial October conflict, Geelong Spot Canola basis to MATIF was narrowing to parity but since October has widened (See Figure 2) as MATIF has increased and local prices declined (due to harvest pressure).
What does it mean?
The cost to Australian trade, indeed global trade, remains uncertain. The situation appears to be escalating with the Biden Administration committing the US military to the area for the ‘longer term’. The Red Sea flash point has the potential to increase costs and delay trade across several commodities. It puts into sharp contrast the fragility of our supply lines on which we all depend..
Have any questions or comments?
Key Points
- Insurance costs for bulk transport through the Red Sea have risen significantly.
- Avoiding the Suez canal and Red Sea will add significant time and distance costs to bulk shipping.
- Impact on Australia might impact shipping schedules to and from the Middle East.
Click on figure to expand
Click on figure to expand
Data sources: Bloomberg, Rabobank, Kiel Institute for the World Economy, Mecardo


