Discussions about changes in the Australian sheep flock and wool clip tend to be focussed on the total or overall clip/flock. However, the flock is made up of wool-focused and prime lamb focussed sheep, with the wool clip split between merino and non-merino. What are the long-term and seasonal patterns for merino and crossbred components of the clip during the past decade?
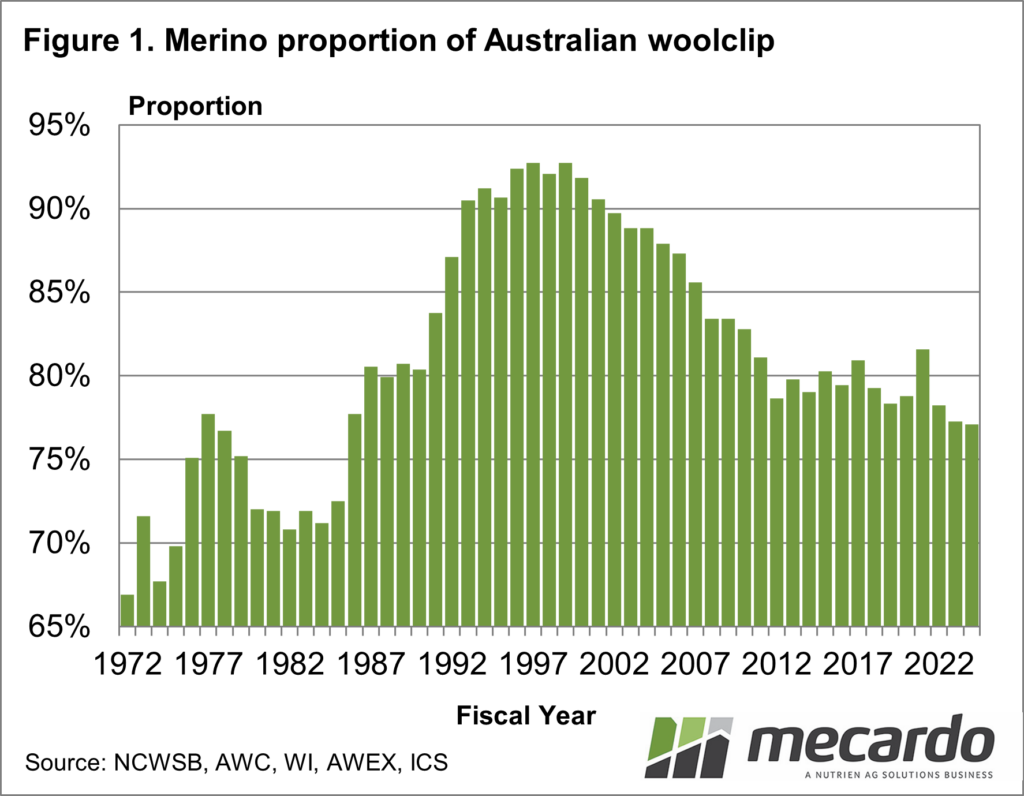
The proportion of merino wool in the Australian wool clip has varied greatly when the clip is looked at over the decades. Figure 1 shows the proportion of the Australian wool clip attributed to merino by season from 1971-72 onwards to the current season to date. In the early 1970s merino wool made up around 67% of the Australian wool clip. From the early 1980s onwards, the proportion rose to reach over 90% in the 1990s. By 2012 the proportion had fallen back to around 79-80%, where it has stayed although easing slightly in recent seasons to around 77%.
When sheep numbers levelled out around 2012, after falling substantially from 1990’s peak levels, the proportion of merino wool also stabilised. This tells us the unsurprising fact that merino sheep numbers made most of the adjustment as the flock was shrinking in the period 1990 to 2012. History shows the proportion of merino in the clip is variable with close to one quarter of the clip now non-merino.
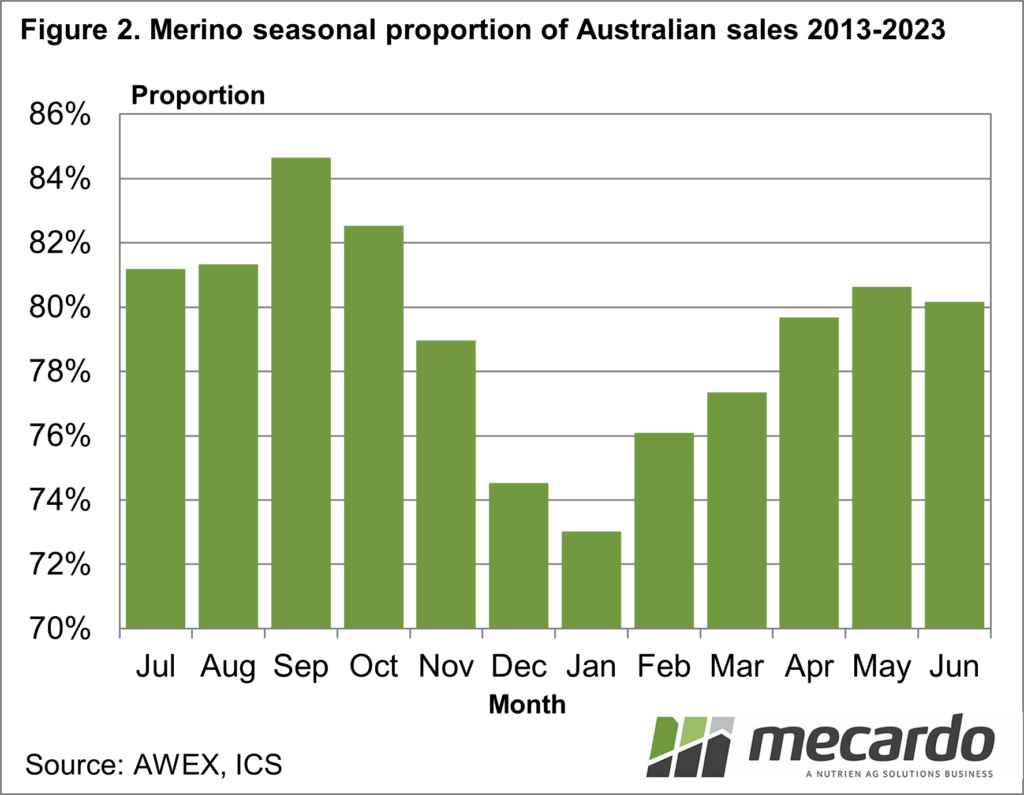
The next two schematics show that the proportion of merino (and crossbred) wool also varies within the season. Figure 2 shows the average monthly proportion (auction sales) of merino wool for the past decade. January has the smallest component of merino wool where it has averaged 73%, with September having the highest component, averaging 85%.
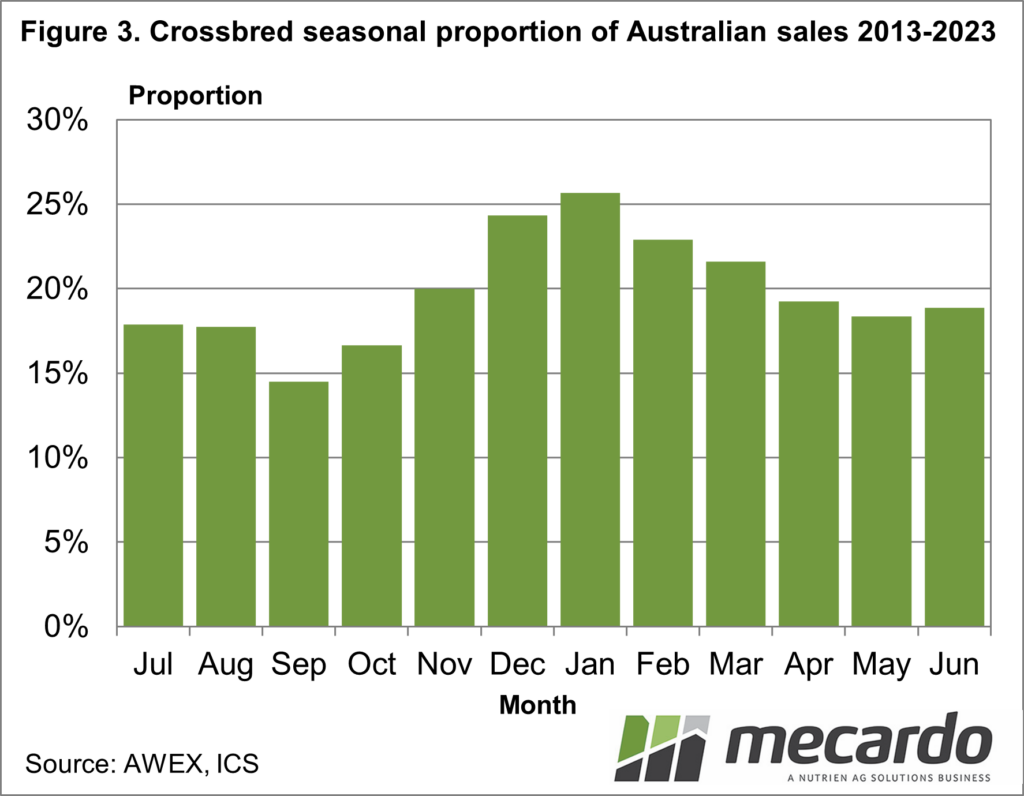
Figure 3 repeats the seasonal pattern for crossbred wool. January is the month of peak crossbred proportion, averaging 26% during the past decade, with September the smallest proportion at 14.5%. In the current market where crossbred prices have eased after having their best rally in years from mid-2023, this seasonal pattern is of interest as it shows supply will be a dampener on crossbred prices through to the next Australian autumn.
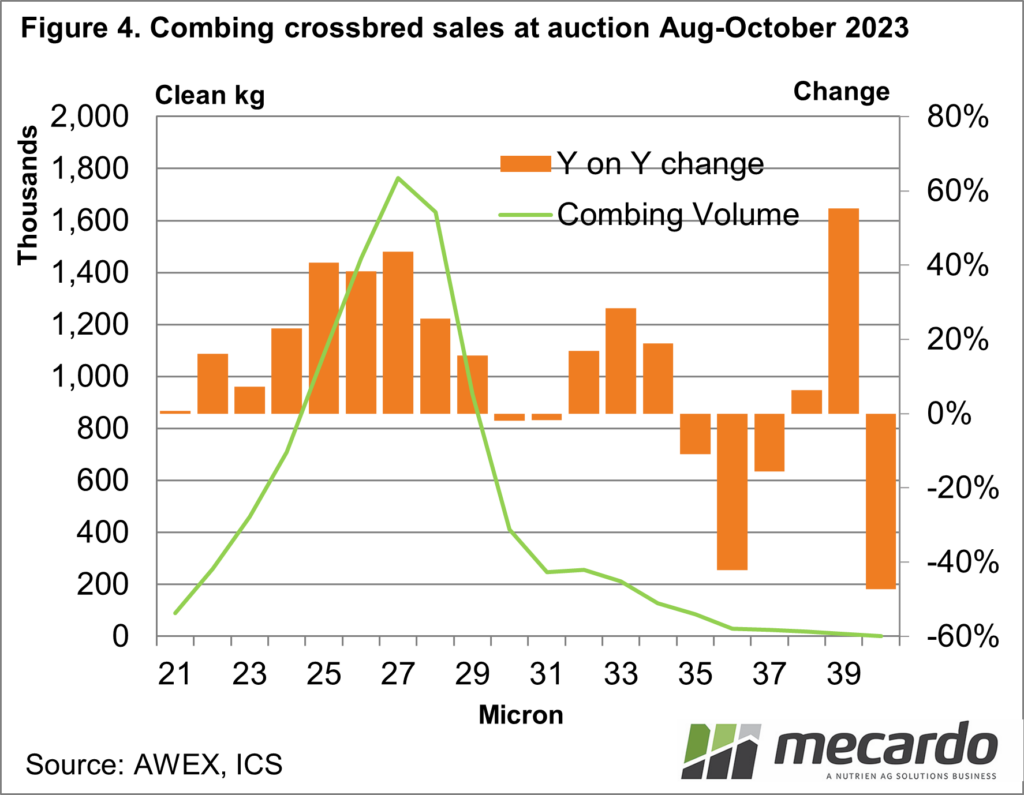
Just as merino wool covers a wide range of categories, so does crossbred wool. Figure 4 shows the volume of crossbred combing wool (21 to 40 micron) sold in the three months to October (line) as well as the year-on-year change for this volume (bars). The 22 through 29-micron categories have had a solid rise in auction volumes sold, whereas changes in the 30-micron and broader category volumes have been varied but generally skewed lower. This helps explain the year-on-year fall in the 27-micron and finer category crossbred prices and quite substantial (in percentage terms) rises in the broad micron crossbred prices.
What does it mean?
Simple total numbers gloss over much detail. When considering the Australian wool clip (sheep flock) there is a significant proportion that is non-merino. The immediate impact is on clip averages such as fibre diameter which is effectively rendered meaningless by the variation in wool production by breed. Trends seen in the Australian wool clip may not reflect changes in the crossbred clip.
The seasonal patterns of supply are also of interest. While the focus of the supply chain is often on weekly auction offerings, the weekly offering total will mean quite different volumes for Merino and crossbred in September versus January.
Have any questions or comments?
Key Points
- The merino proportion of the Australian wool clip has varied widely during the past 50 years.
- Currently nearly one quarter of the Australian wool clip is non-merino.
- In seasonal pattern terms merino reaches its low point as a proportion of the clip in January, when crossbred reaches its maximum.
- Even within crossbred supply there are quite different volume trends that impact on price.
Click on figure to expand
Click on figure to expand
Click on figure to expand
Click on figure to expand
Data sources: NCWSB, AWC, WI, AWEX, AB, ICS, Mecardo


