South Africa is one of the main southern hemisphere merino exporters contributing to the merino supply available to the greasy wool supply chain. In this article, we compare the annual average South African and Australian merino prices, adjusted for point of micron.
The South African merino clip varies in
terms of quality (read here)
by being shorter and broader than the Australian clip, being un-mulesed and
having around half of the clip accredited to the RWS quality scheme. In terms
of volume, the South African merino clip was 12% of the size of the Australian
merino clip (clean terms) in 2022-23. For anyone wishing to look at South
African wool data (annual summaries and weekly market reports) go to the
excellent Cape Wools website (read here).
Given the South African merino clip was
nearly one full micron broader than the Australian merino clip in 2022-23 any
comparison between the two requires an adjustment in fibre diameter. For this
article, the average Australian merino price for the annual average South
African fibre diameter has been used.
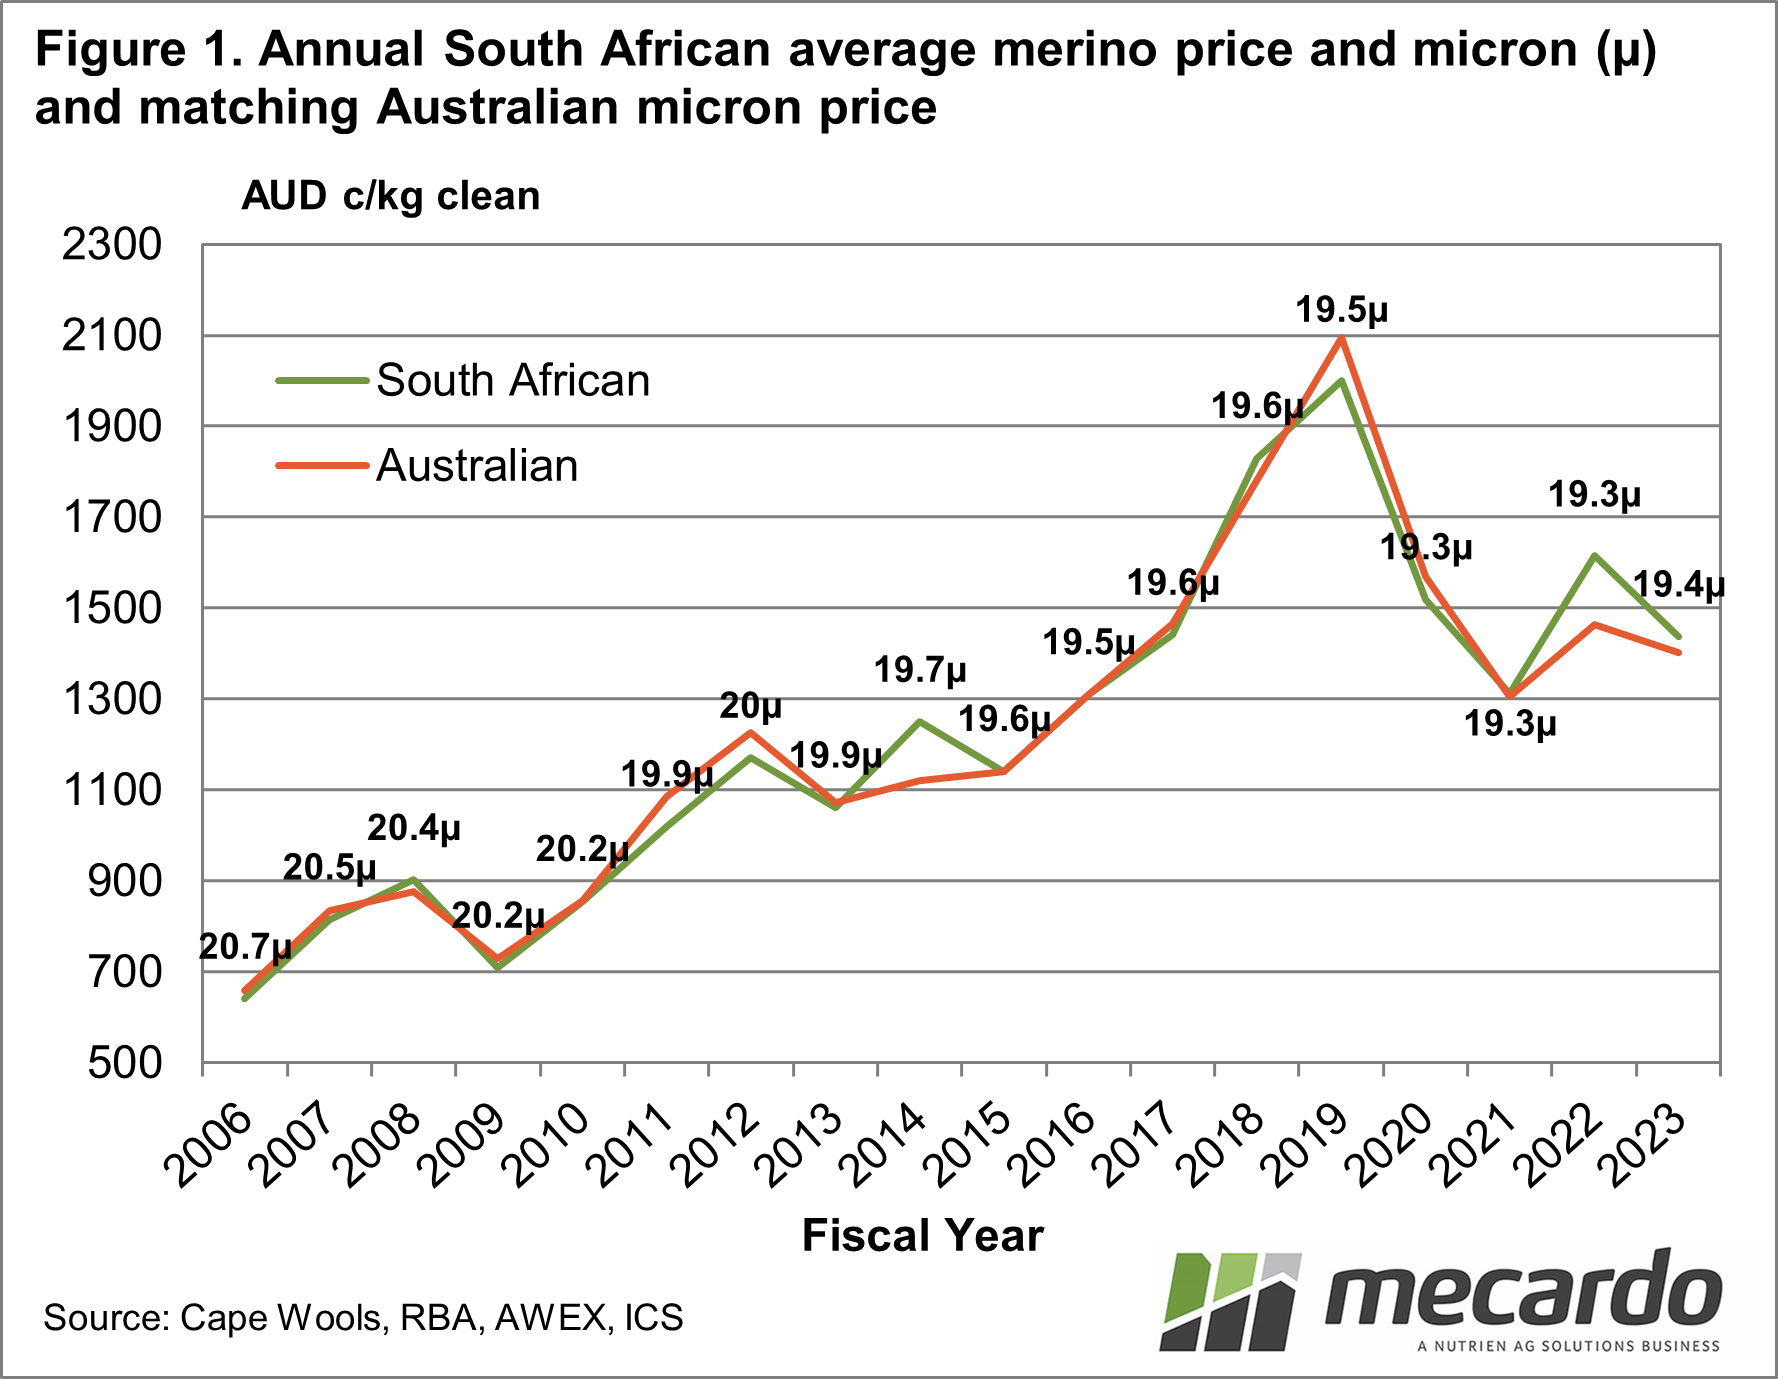
Figure 1 shows the annual South African
merino price (clean terms) from 2005-06 through to 2022-23 (with the average
micron for the South African merino clip shown) along with the average
Australian merino price for the South African fibre diameter. As a general rule,
the values for the two clips follow each other very closely, with 2013-14 and
2021-22 the exceptions where the South African clip value noticeably exceeded
the comparable Australian value.
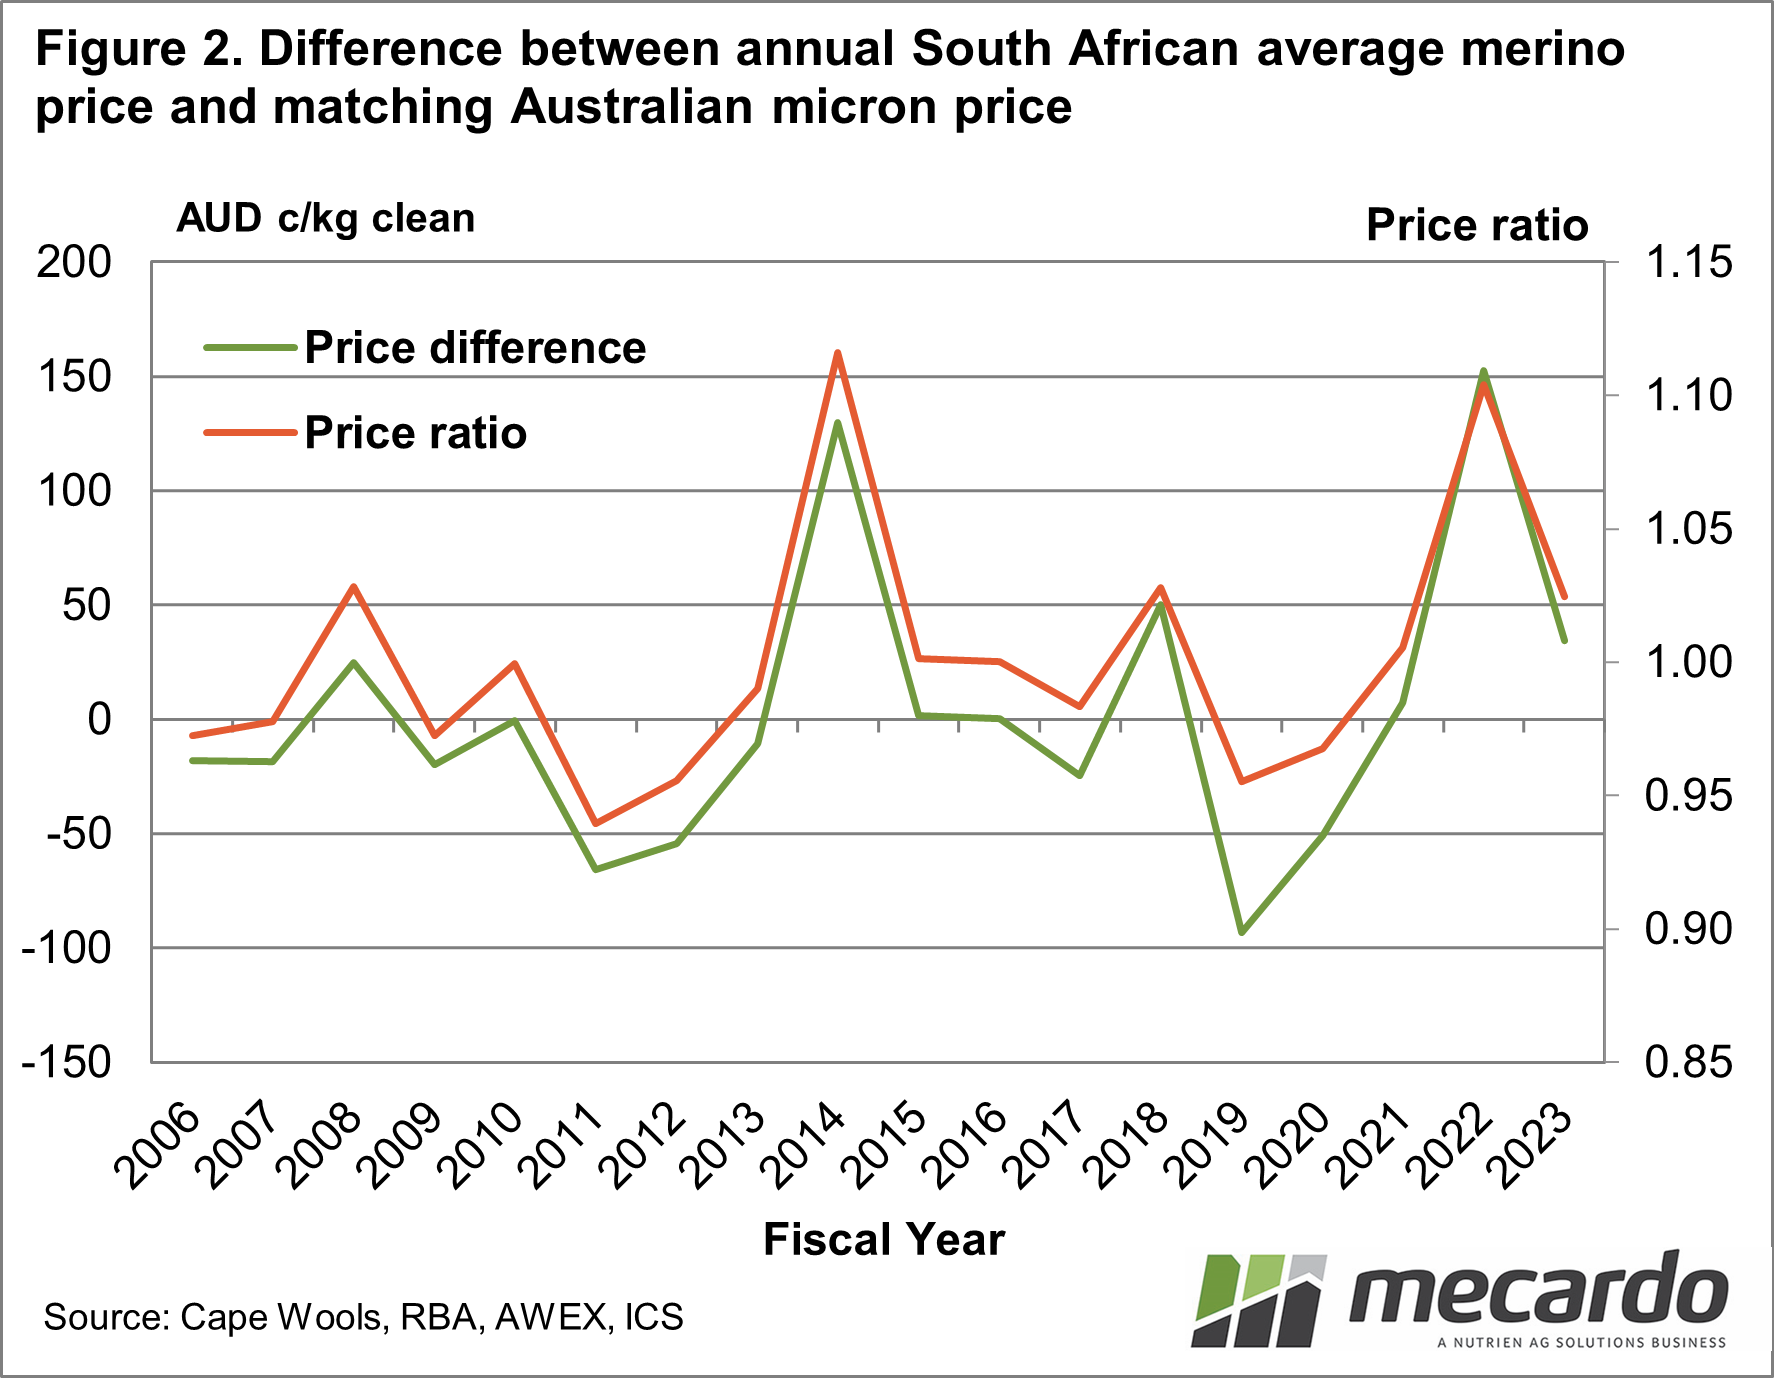
Figure 2 shows the difference between the
annual prices of Figure 1, in both absolute terms (Australian cents per clean
kg) and proportional terms (price ratio). Of the 18 seasons shown, there are
three with substantial differences in the average prices, beyond plus or minus
50 cents clean (plus or minus 5%). The two seasons mentioned above (2013-14 and
201-22) saw the South African clip sell for 150 cents (10-12%) more than the
comparable Australian clip and in 2018-19 the South African clip sold at a
discount of 100 cents (only 4%).
The strong positive correlation between the
two series is to be expected as the supply chain sources wool from different
regions and will only pay more for wool through quality or necessity. The very
close average prices between the two clips match previous experience in
comparing micron indicators/quotes. The South African merino clip, while
varying in quality terms from the Australian clip, is well prepared and sold at
auction (transparently) thereby allowing an accurate comparison.

What does it mean?
The Australian wool industry is prone to thinking it produces the best wool in the world. The comparison in this article shows that the South African merino clip matches or exceeds the value of comparable Australian merino wool. There is nothing like some sibling rivalry to stimulate better performance. For the South Americans, where greasy wool prices at the farm gate level are fairly vague, South Africa shows that other regions can match Australian merino values with the appropriate preparation and attention to detail.
Have any questions or comments?

Key Points
- When adjusted for fibre diameter, the average annual value of the South African and Australian merino clips tend to be within 50 cents clean of each other.
- The strong positive correlation in value between the two clips is not a great surprise, as processors have always drawn and blended wool from different regions.
Click on figure to expand
Click on figure to expand
Data sources: Cape Wools, RBA, AWEX, ICS, Mecardo