
After three tough years in eastern Australia, good rainfall in 2020 has been a blessed relief for most regions. With a change in seasonal conditions from rough to good come changes in the nature of wool delivered to store. One of these changes is an increase in vegetable fault. This article takes a look at patterns in the seasonal supply of vegetable fault (VM).
Supply tends to reach a seasonal low around Christmas and then increases until early in the new season, around August. As the supply of VM changes, the buy side of the market adjusts the relative pricing to account for the decreases and increases (mainly) in the different VM grades. Increased VM basically increases the cost of conversion of wool into top and yarn.
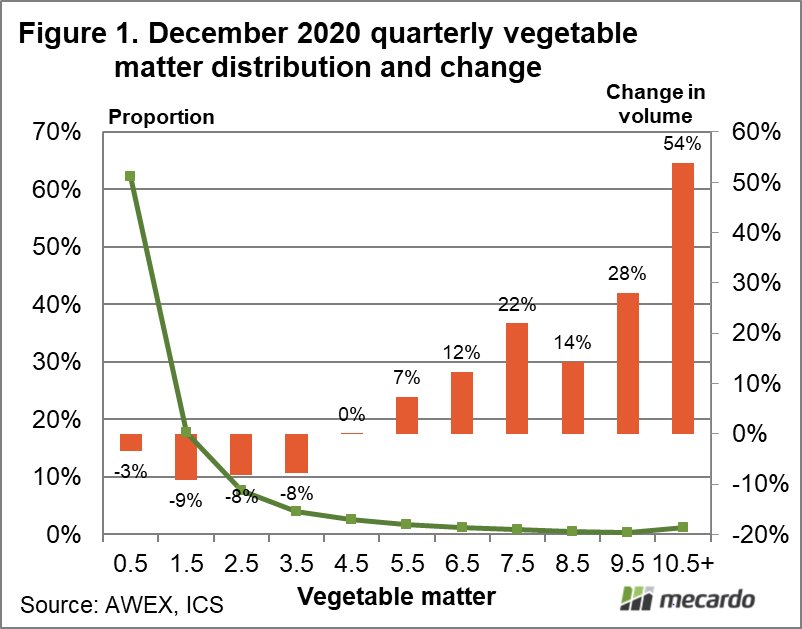
Figure 1 shows the VM level for wool sold in the December 2020 quarter (October to December) by proportion of VM level, with anything above 10% aggregated into one group. The bars show the year-on-year change in volume for the different VM groups. It shows that volume for 3.5% and less VM wool (which accounted for 92% of sales on a clean basis) fell, while volume for 5.5% VM and greater wool rose, with the rise increasing as VM increased. This group with rising volumes only accounted for 5.7% of sales, but keep in mind the industry tends to work on the assumption that last year’s supply is the best guess for this year’s supply with plans built upon that assumption. So, an increased supply of a category which is in this case higher VM wool will tend to lead to lower relative pricing (increased discounts).
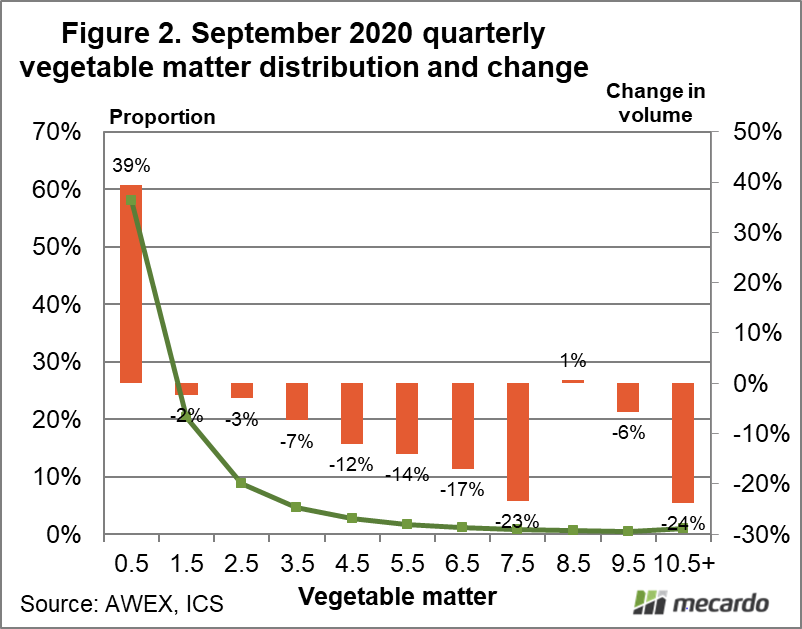
The change seen in the December quarter was associated with increases in VM discounts. Figure 2 shows why. It shows a similar analysis for the September 2020 quarter, in which the supply of higher VM wool was still falling as the lagged effect of drought continued to be reflected in wool production. The switch to increasing supply in the December quarter required a change in relative pricing hence the increased discounts.
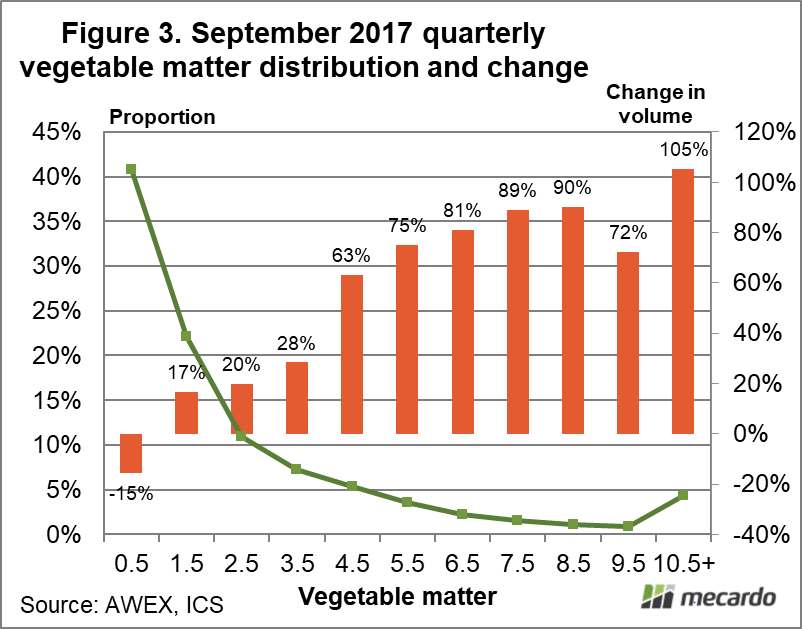
The December quarter is just the beginning as the seasonal pattern tells us. VM levels should continue to increase through to next spring at least. Figure 3 shows what this is likely to look like. It is the change in VM levels in the September 2017 quarter, following the good 2016 season. Only FNF wool (1% and less) decreased in volume – all other VM levels increased markedly. The pressure on prices for higher VM wool is set to continue through most of 2021.

What does it mean?
More pasture means more vegetable matter in the wool, at least in eastern Australia in 2021. In turn, this means the pressure on higher VM wool prices will be downwards relative to the main lower VM categories. VM discounts are likely to widen further. The seasonal pattern in VM levels tells us they will increase through to next spring. What happens after that depends on rainfall between now and then.
Have any questions or comments?

Key Points
- The effect of improved seasonal conditions in 2020 in eastern Australia started to be reflected in higher VM levels in the December quarter.
- Discounts increased for higher VM as a consequence.
- The supply of higher VM wool is set to continue increasing through to late 2021.
Click on figure to expand
Click on figure to expand
Click on figure to expand
Data sources: AWEX, ICS, Mecardo


