
Price volatility does not have a good reputation with farmers, especially when prices fall, such as was the case with sheep meat in 2023. A recent query, implying fine merino price volatility is too great has prompted this article in which we take another look at price volatility in wool prices.
Extensive agricultural prices are inherently variable
because production, hence supply, is rainfall dependent and rainfall is
variable. For merino wool, this change in production tends to be incorporated
into the market by way of changes in relative prices (premiums and discounts)
in the greasy wool market (as distinct from various forms of processed wool) such
as increases/decreases in micron premiums and discounts. Overlaying this factor
for wool are the swings in demand coming from cycles in economic conditions,
which are the key drivers of cycles and trends where wool is different to other
extensive agricultural commodities such as meat, grains and oilseeds.
For this article, 12-month price changes for the past two
decades have been used, derived from weekly data. There are various ways of
expressing price volatility but this simple approach was used as it mimics the
majority of wool production which tends to be shorn and sold at 12 monthly
intervals. Deflated price series were used to strip out the effect of inflation
and allow comparison of price changes across the two decades.
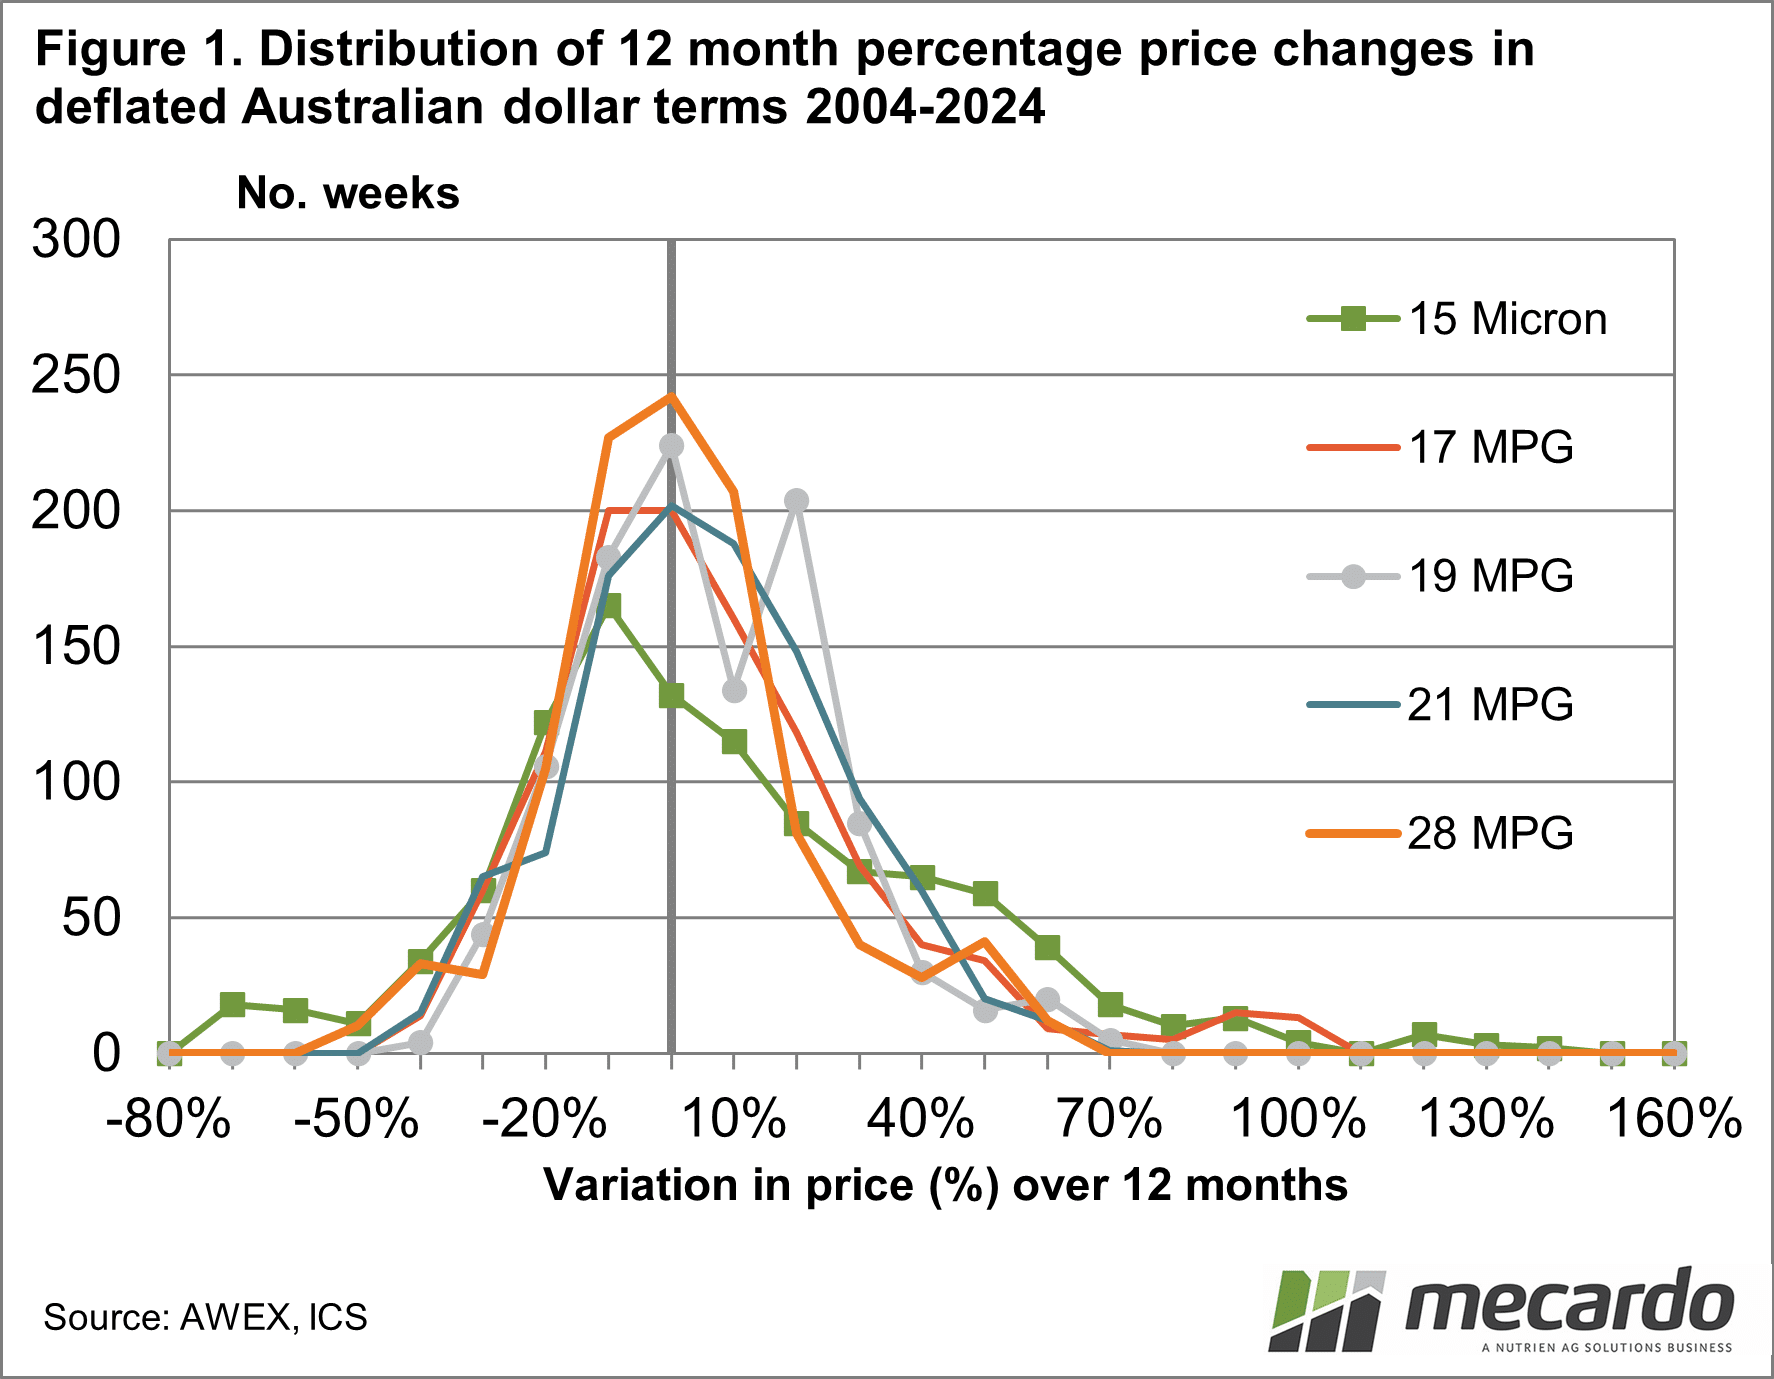
Figure 1 shows the distribution of percentage price changes
for 12 months, using weekly data for the past 20 years from 15 micron through to
28 micron in deflated Australian dollar terms. The vertical line in the graph
is set at zero. As wool markets tend to halve and double through cycles you
will notice the right-hand side of the graph (price rises over 12 months) are
more extended then the price falls shown by the left-hand side. Prices with
lower volatility will have their distribution bunched closer to the zero axis
(such as the 28 MPG) and series with higher price volatility will be more
spread out (such as the 15 micron).
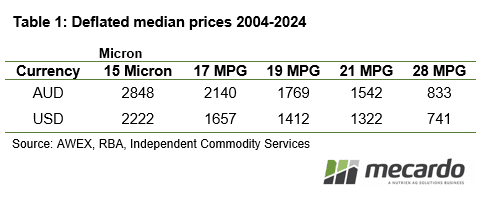
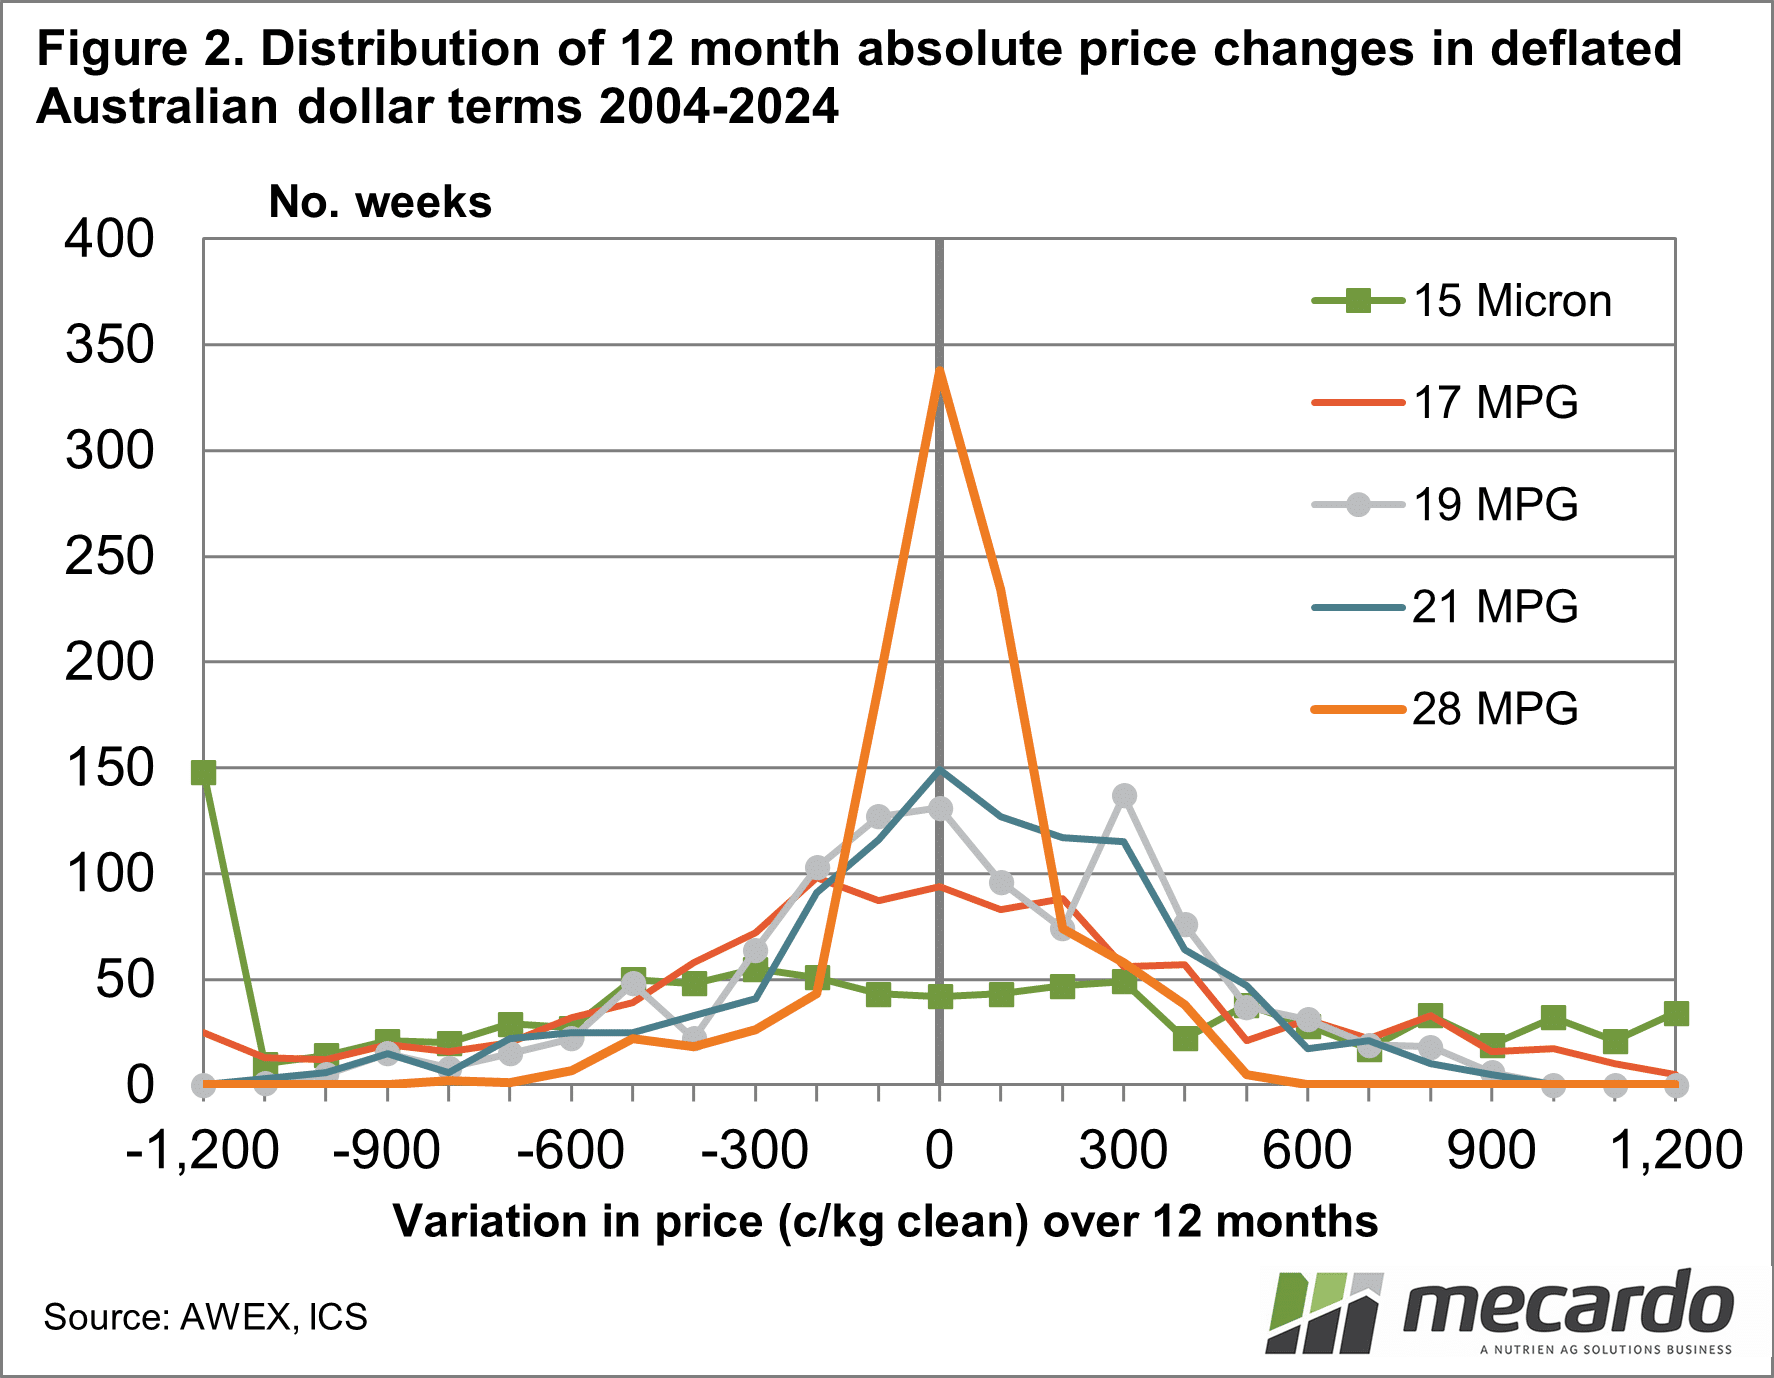
Figure 2 repeats the analysis using absolute (cents per
clean kg) terms. Viewing price volatility this way splits the performance of
the different micron categories apart, with the 28 MPG bunched up around the
zero axis and the 15 micron price changes spread out. There is no real surprise
in all of this, as it fits with the general experience of the greasy wool
market. The key thing to remember is that the various micron price series start
from a different base, as Table 1 shows. The 28 MPG might have the lowest price
volatility, but the trade-off is that it has the lowest median price with the
opposite applying to 15 micron.
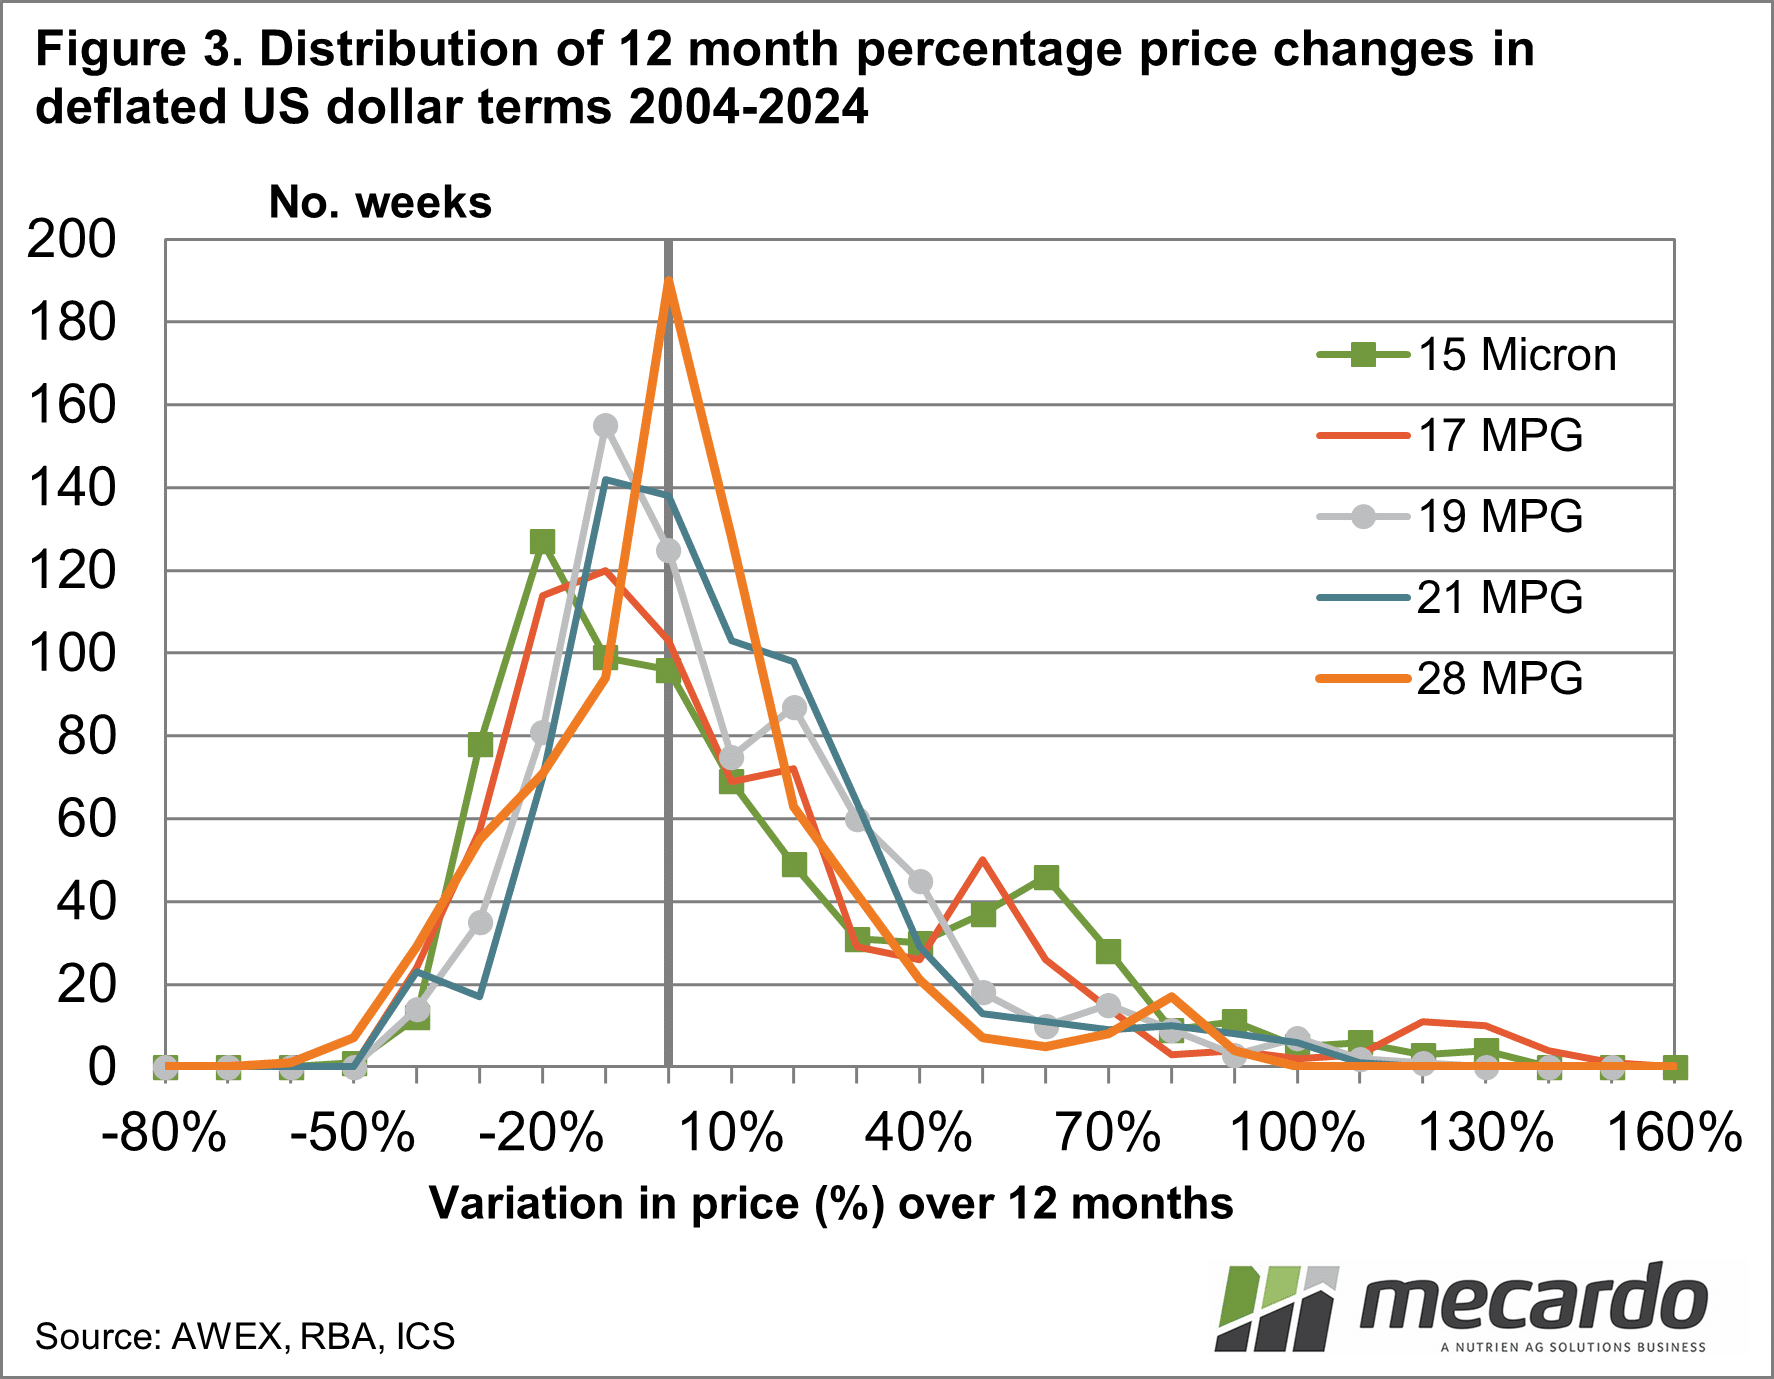
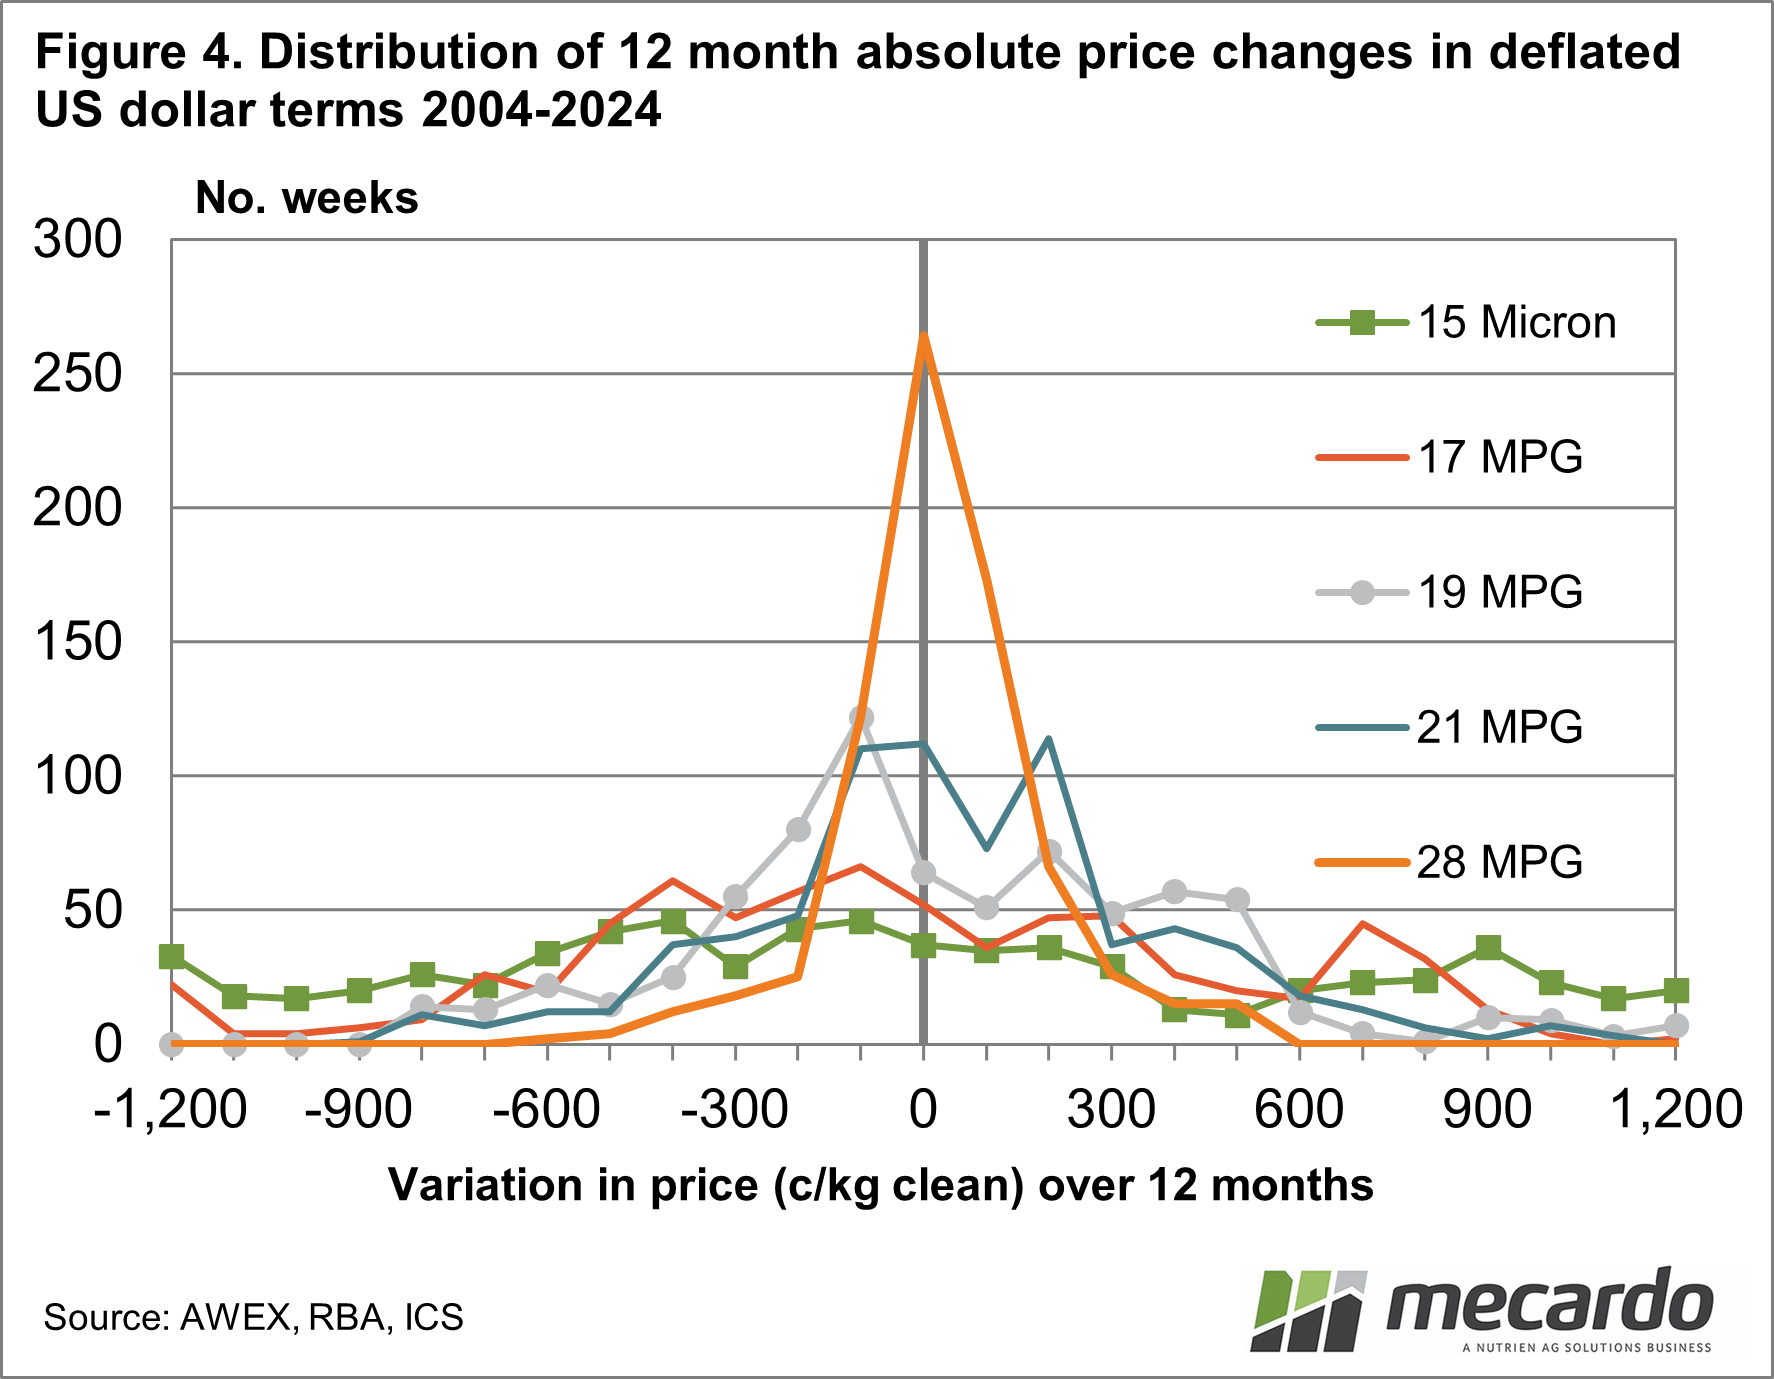
Figures 3 and 4 repeat the exercise in US dollar terms for
our overseas readers. The US dollar seems to tighten up the schematics, tidying
up the tails of the distributions.
In practice price volatility is something of a distraction,
compared to the long-run median price which will drive long-run fleece value. A
simple test of this is to consider the likelihood of farmers switching out of
17 micron to 28 micron wool in order to lower the price volatility they are
exposed to.

What does it mean?
In proportional terms price volatility does increase as fibre diameter decreases, but nowhere as much as it does in absolute terms. The price volatility in absolute terms is much larger as the base price increases as the micron decreases. Ultimately it is the longer-run enterprise returns, driven by the long-run price, which will be a key determinant of micron choice for merinos.
Have any questions or comments?

Key Points
- Price volatility tends to increase as fibre diameter decreases, more so in absolute terms.
- Correspondingly long-term prices increase as fibre diameter decreases.
Click on figure to expand
Click on figure to expand
Click on figure to expand
Click on figure to expand
Click on figure to expand
Data sources: AWEX, ICS, RBA, Mecardo


