
At the fine end of merino wool production cashmere prices are viewed with envious eyes by wool producers, although vicuna fibre is much more expensive (as it is much rarer). This article takes a look at the relationship between 15 and 16 micron wool prices with cashmere.
Mecardo looked at the relationship between 16-micron wool and cashmere prices last year, which showed a high and low price ratio to cashmere within which the 16-micron price generally traded. In this article the 16 micron combing fleece price is again looked at, in conjunction with a 16 micron carding series (a simple average of 16 micron locks and crutchings). In addition the analysis is extended 1 micron finer to 15 micron, which is even more on the edge of the merino fibre diameter distribution making up only 1% of annual merino production in contrast to 16 micron which makes up about 5%.
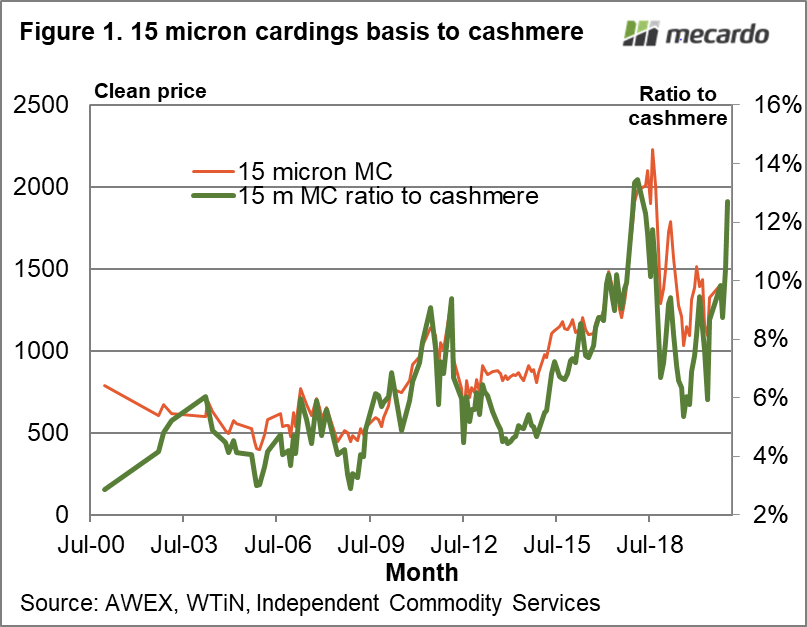
In Figure 1 a 15 micron cardings prices series (left hand axis) is compared to its ratio to a cashmere price series (right hand axis). There are two points to note. Firstly the price for 15 micron cardings has trended higher in the past 10-12 years and secondly its ratio to cashmere looks to be driven by its price, implying there is little relationship between the price for this series and cashmere.
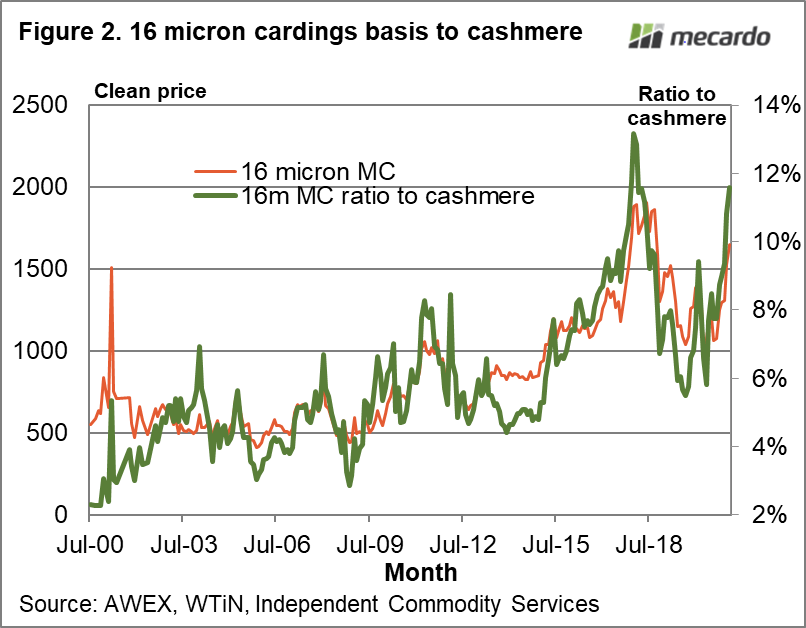
Figure 2 repeats the analysis of Figure 1 using a 16 micron carding series. The 16 micron carding price has also trended higher in the past decade, albeit with some big cycle swings in value. The ratio to cashmere had an upper and lower bound through to 2010, since when the carding price is driving the ratio without any neatly defined limits.
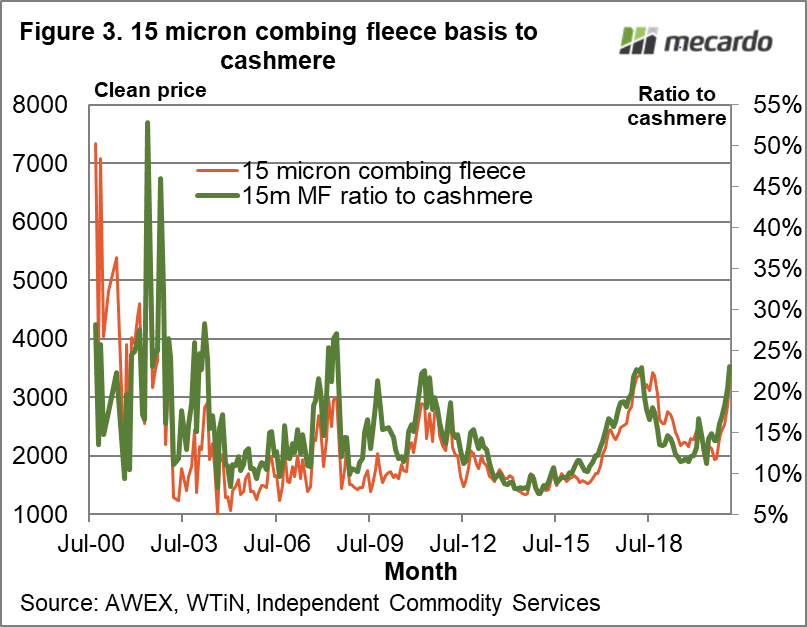
Figure 3 will bring back memories to some superfine growers, with the high prices of 2002. Since 2003, the price ratio to cashmere has generally reached an upper limit around 25% with 8-10% of the cashmere price the lower bound.
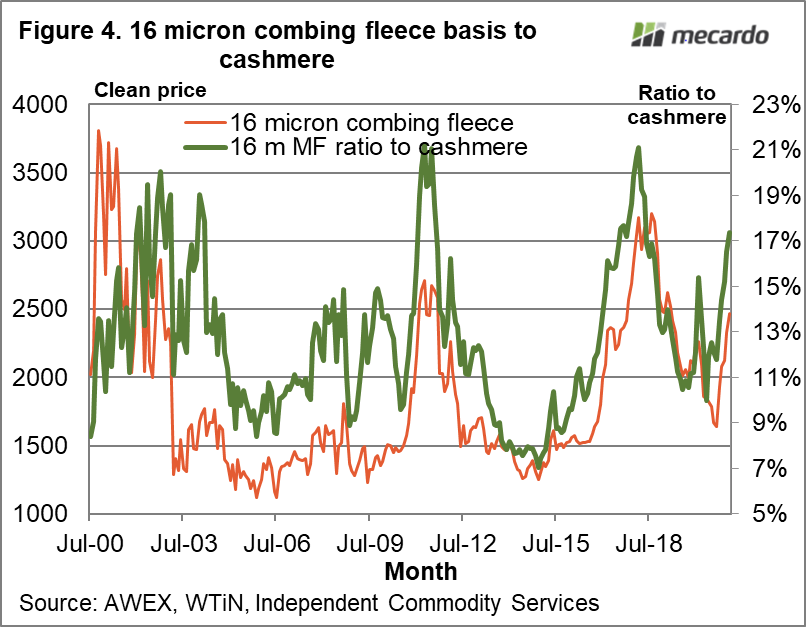
In Figure 4 the 16 micron combing price series is shown along with its price ratio to cashmere, since mid-2000. During the past two decades, 20-21% has tended to be the upper limit for the 16 micron to cashmere price ratio, with 8-10% the lower limit. The current price ratio is 17%, towards the upper range but still some way below the upper limit. The 16 micron to cashmere price ratio is driven in terms of cycles by the 16 micron price but the ratio limits operate at different level of the 16 micron price, especially the cyclical peak prices.

What does it mean?
While the price ratio for 16 micron fleece to cashmere are still below its upper limit of the past two decades, carding prices for these two micron categories are pushing up towards their peak levels reached in 2018, and the 15 micron combing fleece price ratio is close to its peak levels of the past couple of decades. 2018 was the peak in the apparel fibre price cycle. This implies the fine end of the merino market is getting close to what has been “full value” in recent decades. If the cashmere price continues to rise then there is scope for these categories to follow it higher.
Have any questions or comments?

Key Points
- While the 15 and 16 micron combing fleece price ratio to cashmere look to have definable boundaries, the carding series do not.
- Possibly it is a case of the market changing, as it appears to from the increase in 15 and 16 micron carding price ratios to cashmere in the past decade.
Click on figure to expand
Click on figure to expand
Click on figure to expand
Data sources: AWEX, WTiN, Independent Commodity Services P/L , Mecardo


