
With the 21 MPG down by 800 cents (about 45%) since January, it is timely to check again how merino wool is tracking in relation to other fibres. This article takes a look at the relationship between the 21 micron indicator and cotton prices.
Wool prices, the market itself a group of related greasy wool markets, are part of a much larger group of apparel fibre markets. As such the major trends and cycles in wool prices are generally similar to the major trends and cycles operating in the major apparel fibres. In early July Mecardo looked at the price ratio of the average merino micron price to cotton, showing how lower supply was correlated to higher price ratios.
Figure 1 shows a monthly price series for cotton from 1980 to this month in Australian cents per kg terms (right hand axis) along with the 21 micron indicator (left hand axis). There are periods of common trends such as the pick up in price from the late 1990s through to 2018 and the weakness in price since 2018. There are also periods of complete disengagement between the series such as in 1988 when wool rose to a high peak while cotton traded at low levels. Cotton prices are holding up well in 2020, on lower volumes which are best seen in the increase in stocks last season of 3 million tonnes and the projected increase this season of another 1 million tonnes.
Figure 2 shows the 21 micron prices series as in Figure 1 along with the price ratio of the 21 micron indicator to the cotton price series. In relation to cotton the two big peaks in the 21 micron price are 1988 and 2018, where the price ratio was close to 10. For August to last week the price ratio has averaged a much lower 5.5. The old ratio of three, (wool to cotton prices), still gets a mention in the press occasionally. This was the standard ratio for the 1980s and through the 1990s. With the final liquidation of the RPS stockpile in 2001, the price ratio leapt higher to trade between 5 and 7 in the following decade. It seems reasonable to expect that this ratio is the more sustainable range, even if the wool price spends sometime in the near future at lower levels.
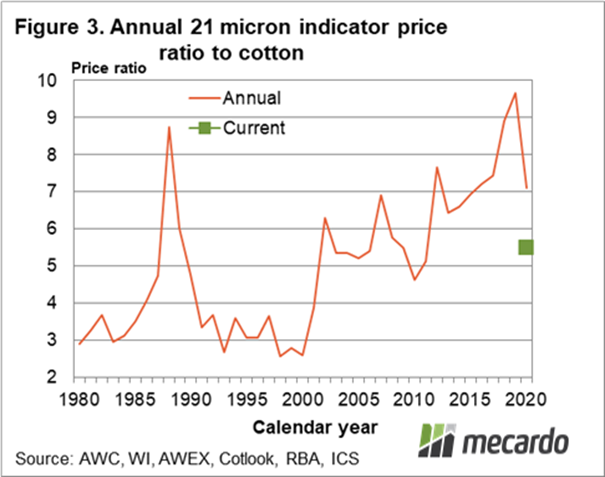
In Figure 3 the annual (calendar year) average of the 21 micron to cotton price ratio is shown from 1980 through to 2020 (to date). In addition the current ratio level is shown. The annual data clears away some of the noise of the monthly data and shows how the price ratio was depressed during the 1990s when the market was struggling in the aftermath of the collapse of the Reserve Price Scheme. While the price ratio will not tell us where prices are going to be in a months’ time, it does give a view of the likely relativity of wool prices to cotton in future years. That view suggests wool prices will be trading around six to seven times that of cotton, with cycles occasionally taking the price ratio above and below this range.

What does it mean?
Greasy wool prices and wool prices ratios to other fibres remain under extreme downward pressure as the supply chain struggles to cope with large slabs of demand missing. Cotton stocks are increasing, as are greasy wool stocks, as supply overwhelms a much reduced demand. In a similar vein cashmere trade volumes have collapsed (to May 2020 at least). Looking forward into 2021 and 2022 when recovery from the pandemic takes place, the price ratio shown in this article point to wool prices recovering from current levels.
Have any questions or comments?
Key Points
- The 21 micron price ratio to cotton has fallen to near the low levels of the decade 2000 to 2010.
- Looking beyond the effects of the pandemic it is reasonable to assume that wool price ratios to cotton will increase from current low levels.
- A 21 micron price ratio trading between six and seven would deliver a 21 micron price of 1160 to 1351 cents on the current cotton price and exchange rate.

Click on figure to expand

Click on figure to expand
Click on figure to expand
Data sources: AWC, WI, AWEX, Cotlook, ICAC, RBA, ICS


