
Cotton prices are down 30-35%, depending on how prices are measured, on the high levels seen in May. How does this relate to broader merino wool prices?
Mecardo recently looked at cotton price levels and wool to cotton prices ratios in May (view here), with cotton outperforming most apparel fibres in their recovery from the 2020 COVID-induced fall in prices. In this article, we have updated the graphics shown in the earlier article to see how the new, lower cotton prices relate to the 21 Micron Price Guide (MPG) for broader merino wool.
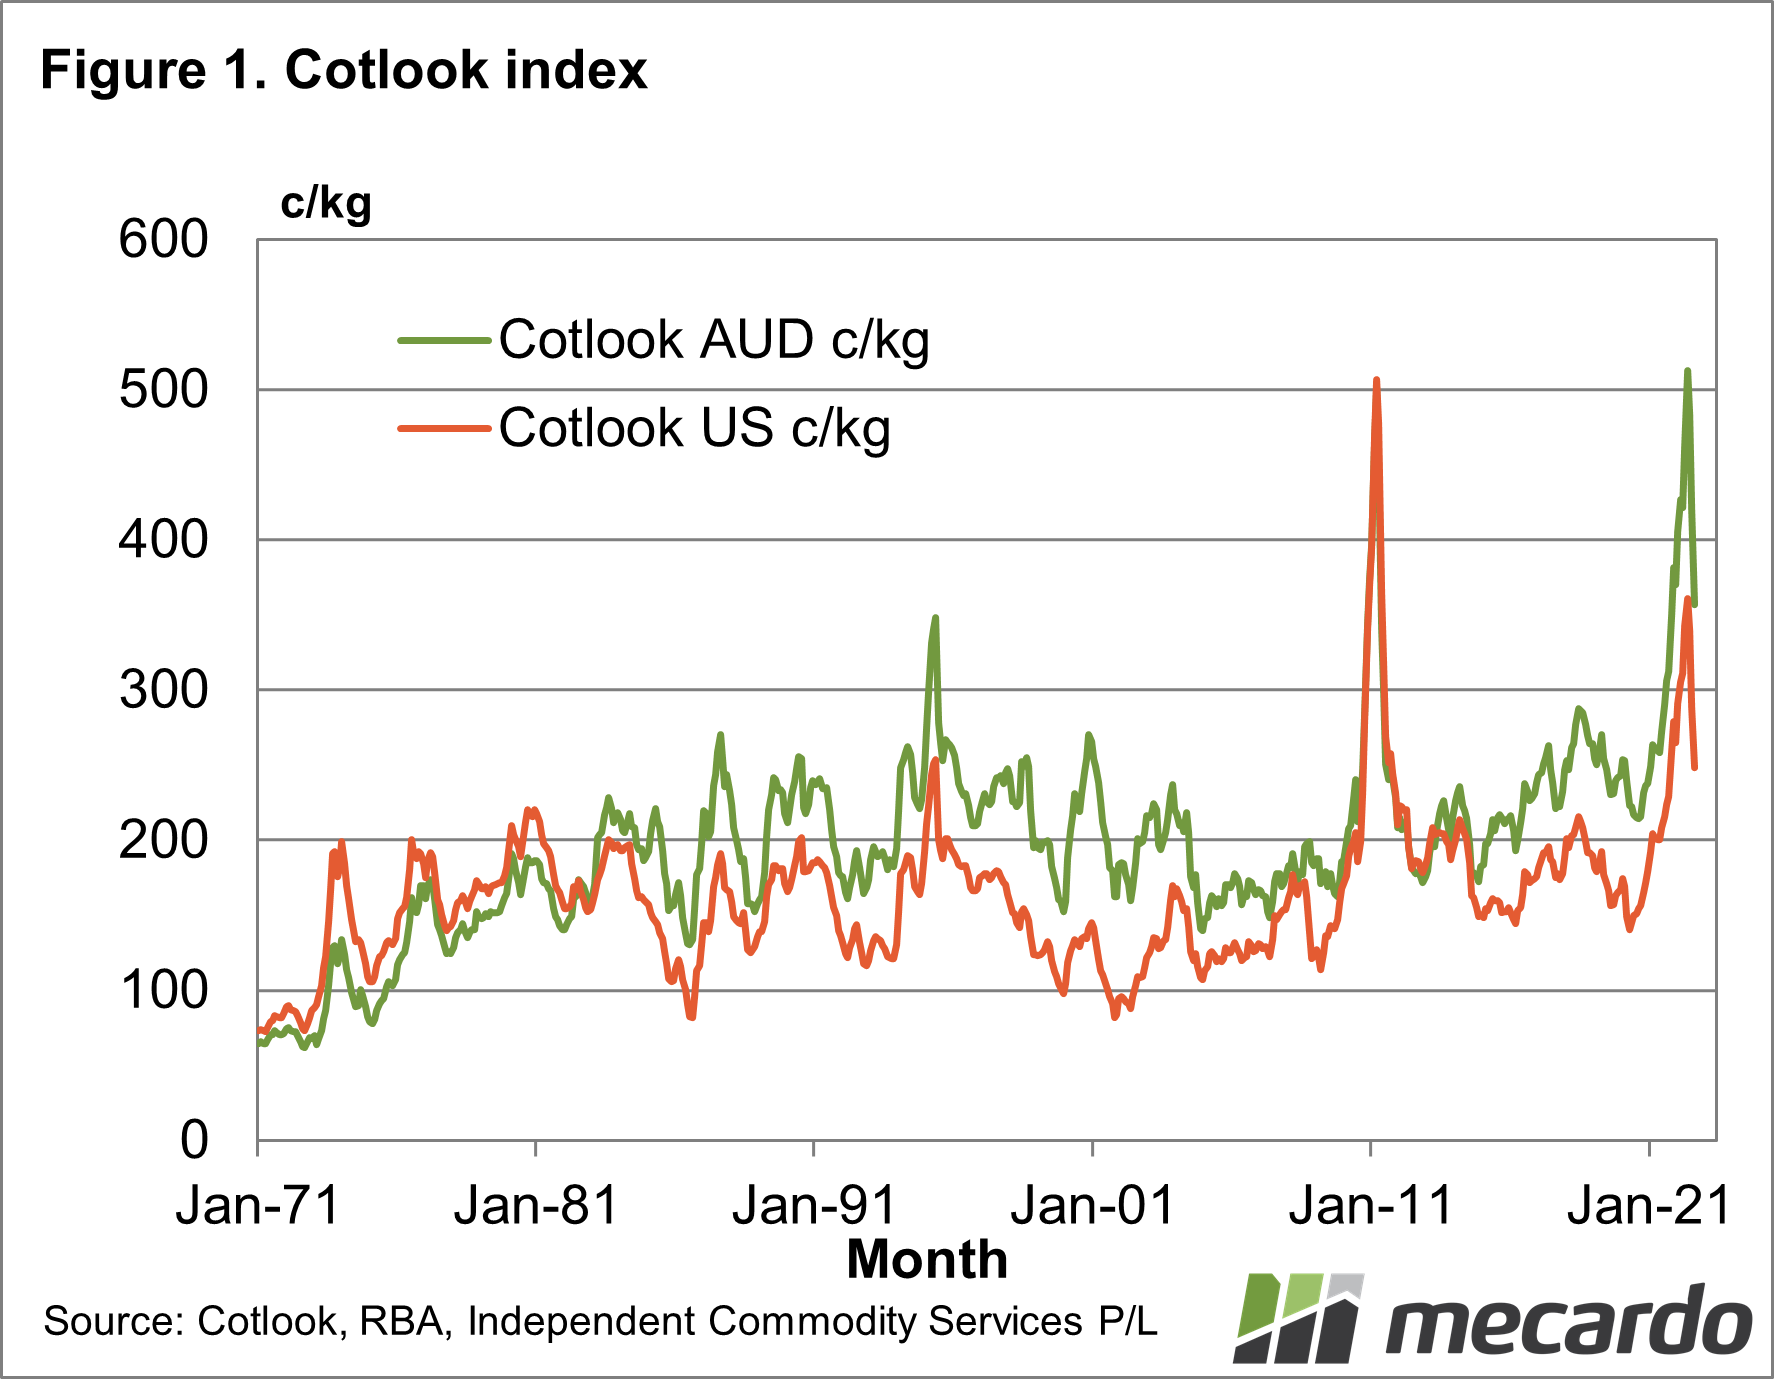
As the earlier article noted, cotton prices rebounded out of the 2020 lows, rising by 150%, which in turn drove the 21 MPG to cotton price ratio down to a lowly 2.5. Figure 1 shows the Cotlook Index in both Australian and US dollar terms from 1971 to this month (to date). Monthly averages of the Cotlook Index are used in the graphics, in calculations of price changes and price ratios. In US dollar terms the 2011 peak stands out, while in Australian dollar terms the 2022 peak stands out.
Since the recent May high, the index is down 31% in Australian dollar terms (monthly averages) and down 35% in US dollar terms (daily data). Such a fall in price is consistent with general down cycles in cotton since the early 1970s. There have been seven down cycles of 30-40% magnitude since the early 1970s with another three of greater magnitude and another couple of lesser magnitude. While the current fall in price is in line with normal down cycles in cotton, the starting price level was extremely high so that the current 10 year price rank in both Australian and US dollar terms remains in the top decile. This means that while cotton has fallen 30-35% in the space of three months it remains expensive by the standards of the past decade.
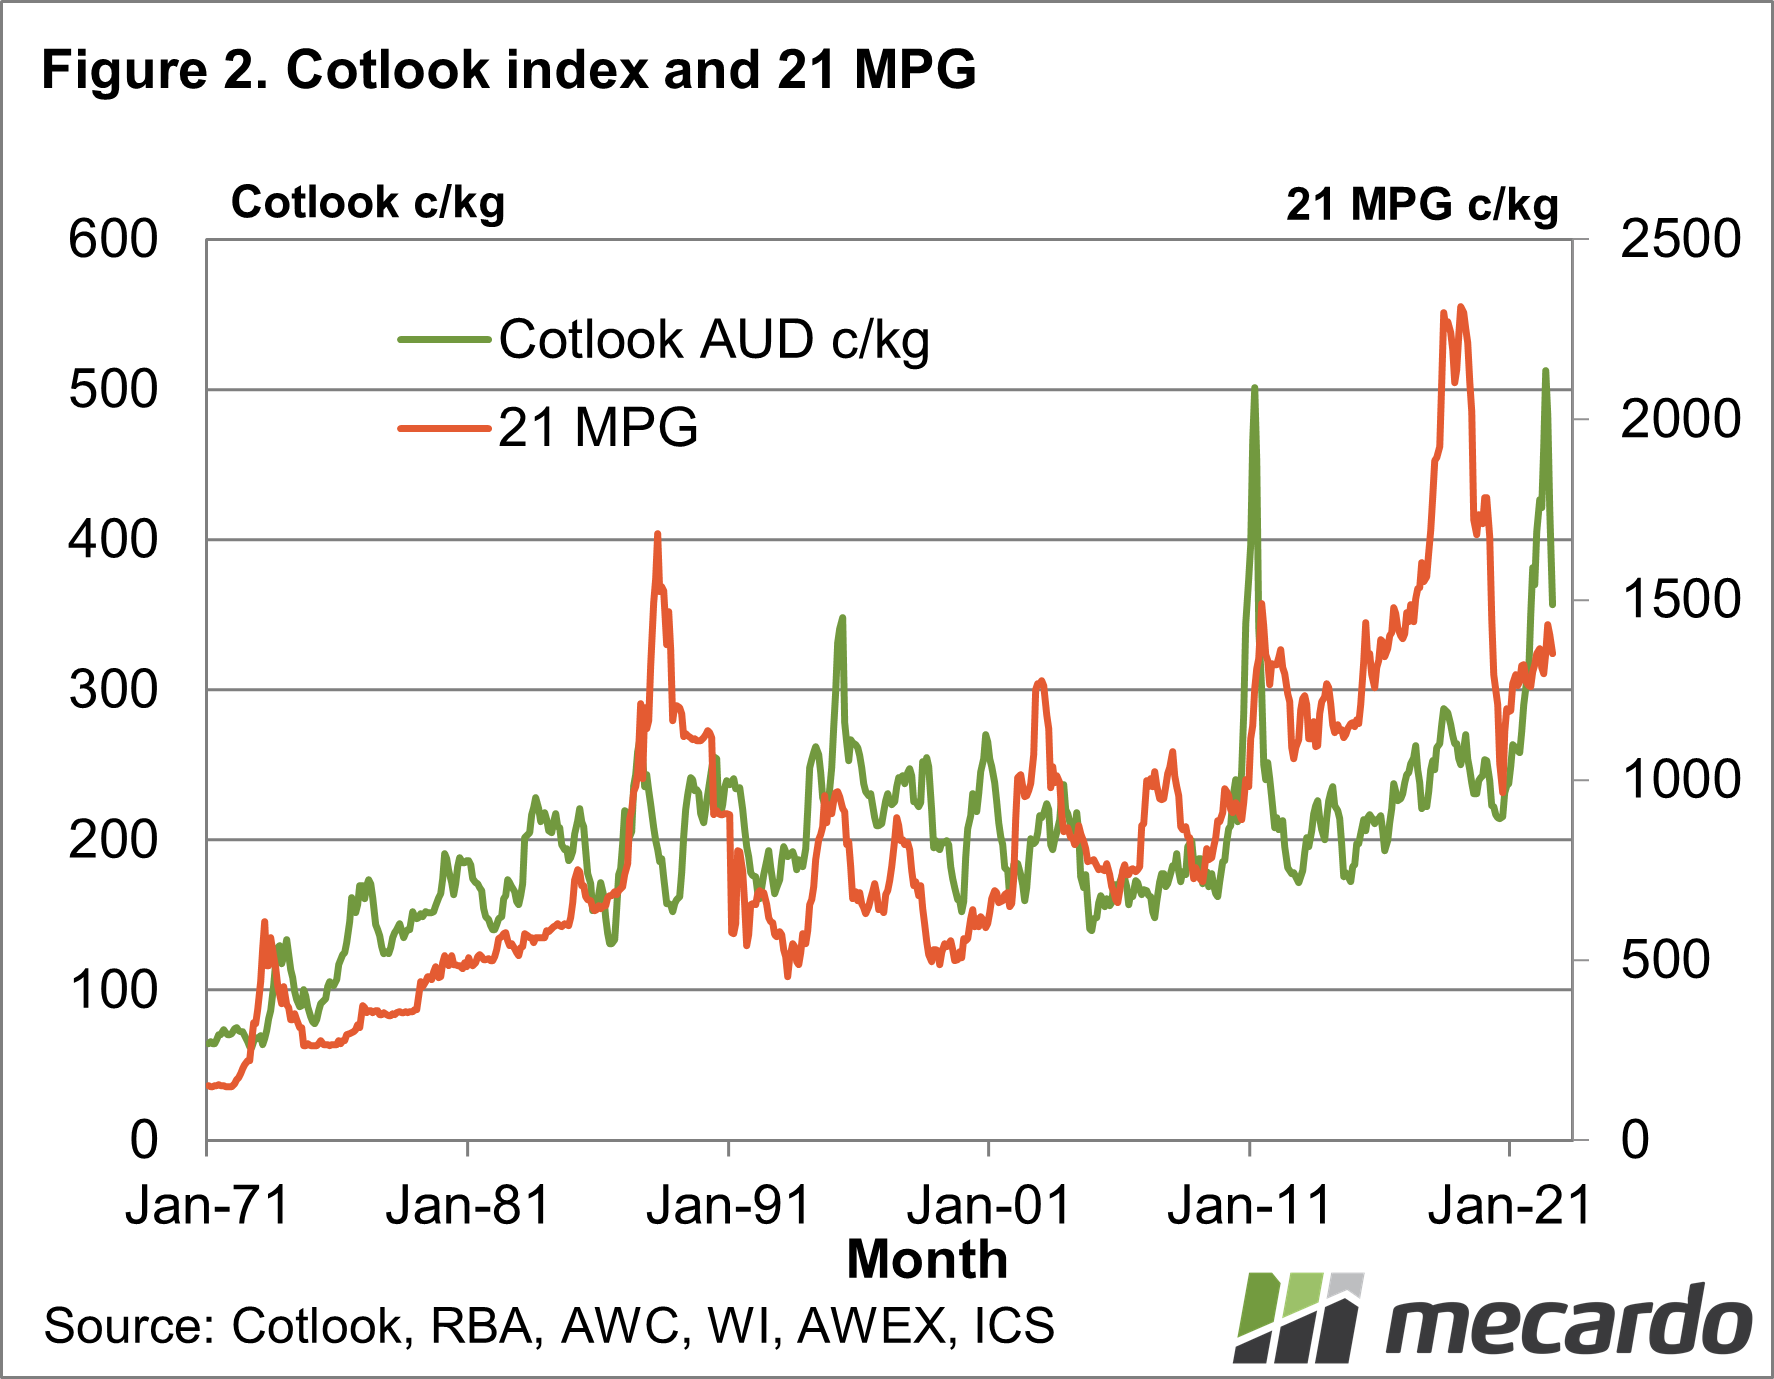
Figure 2 compares the Cotlook Index and the 21 MPG in Australian dollar terms from the early 1970s. As August is only one-quarter past, we have used the average cotton price to date and assumed the 21 MPG will be 50 cents lower than the July price. The relationship between the cotton and 21 MPG price cycles is quite varied which implies that cotton (as it is the bigger market) is not necessarily a good indicator of wool prices.
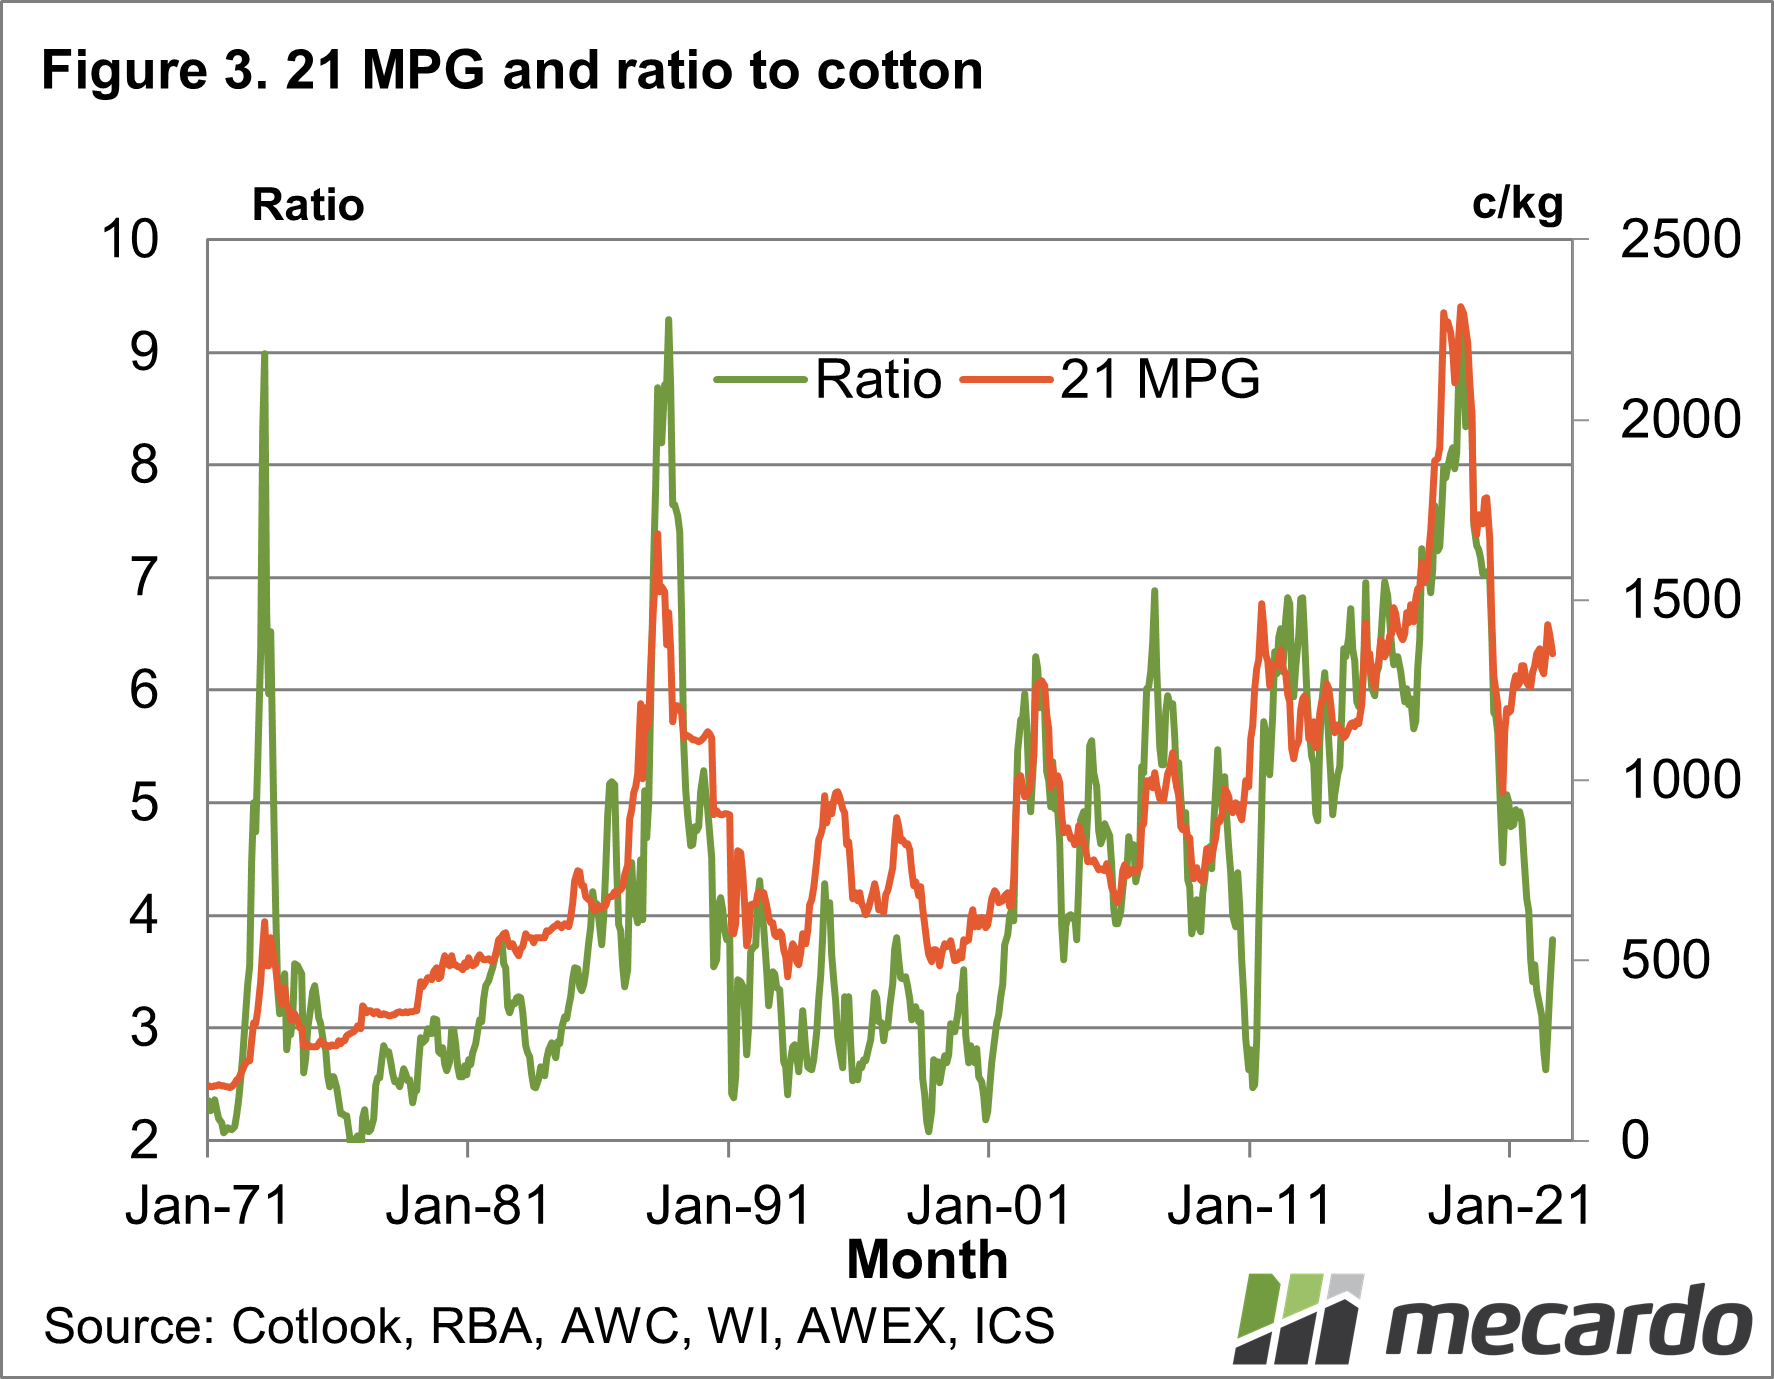
Figure 3 shows the 21 MPG and the ratio of the 21 MPG to the Cotlook Index from the early 1970s. The peak ratio is around 9 (where the 21 MPG is nine times the Cotlook Index) reached in 1973, 1988 and early 2019. Each of these periods was a time of extremely strong wool prices. On the other side, a ratio of 2-2.5 is the low side of the ratio, a level reached more often, especially in the decade of the 1990s as the market struggled under stockpiles accumulated in the late 1980s under the auspices of the reserve price scheme.
Despite the 31% fall in Australian dollar terms for the Cotlook Index, the 21 MPG to Cotlook Index ratio has only lifted to 3.8. The ratio has only spent 8% of the past 20 years below this level, so the broader merino category remains very cheap in relation to the cotton index.

What does it mean?
The recent fall in cotton prices still leaves cotton prices at high levels, with the 21 MPG still cheap in comparison. Cyclical variations in cotton prices are not necessarily a good guide to comparable cyclical variations in the 21 MPG, so the recent fall in cotton price looks to be cotton “coming back to earth”. This does not mean wool prices will not ease in the coming spring (there is a recession about in the world) but is a cautionary tale about simply projecting the recent fall in cotton prices onto the greasy wool market.
Have any questions or comments?

Key Points
- Cotton prices have fallen by 30-35% since the recent May 2022 price highs.
- Keep in mind the cotton price fell from extremely high levels as it remains in the top decile for the past decade.
- The 21 MPG to Cotlook Index price ratio remains at a low level.
Click on figure to expand
Click on figure to expand
Click on figure to expand
Data sources: Cotlook, Emerging Textiles, RBA, AWC, WI, AWEX, ICS , Mecardo


