The drop in meat prices since mid-2022 has affected beef, lamb, mutton, and goat. This article investigates the relationship between goat meat prices and other extensively grown meats during the past two decades.
In past Mecardo articles, we have looked at lamb as being the upper bound for goat meat prices and mutton as being the lower bound. Mutton as a ratio of the lamb price varies widely according to supply, from 80-90% at peak levels to around 30% at low levels (currently 27%), which leaves a wide range for goat prices to range within.
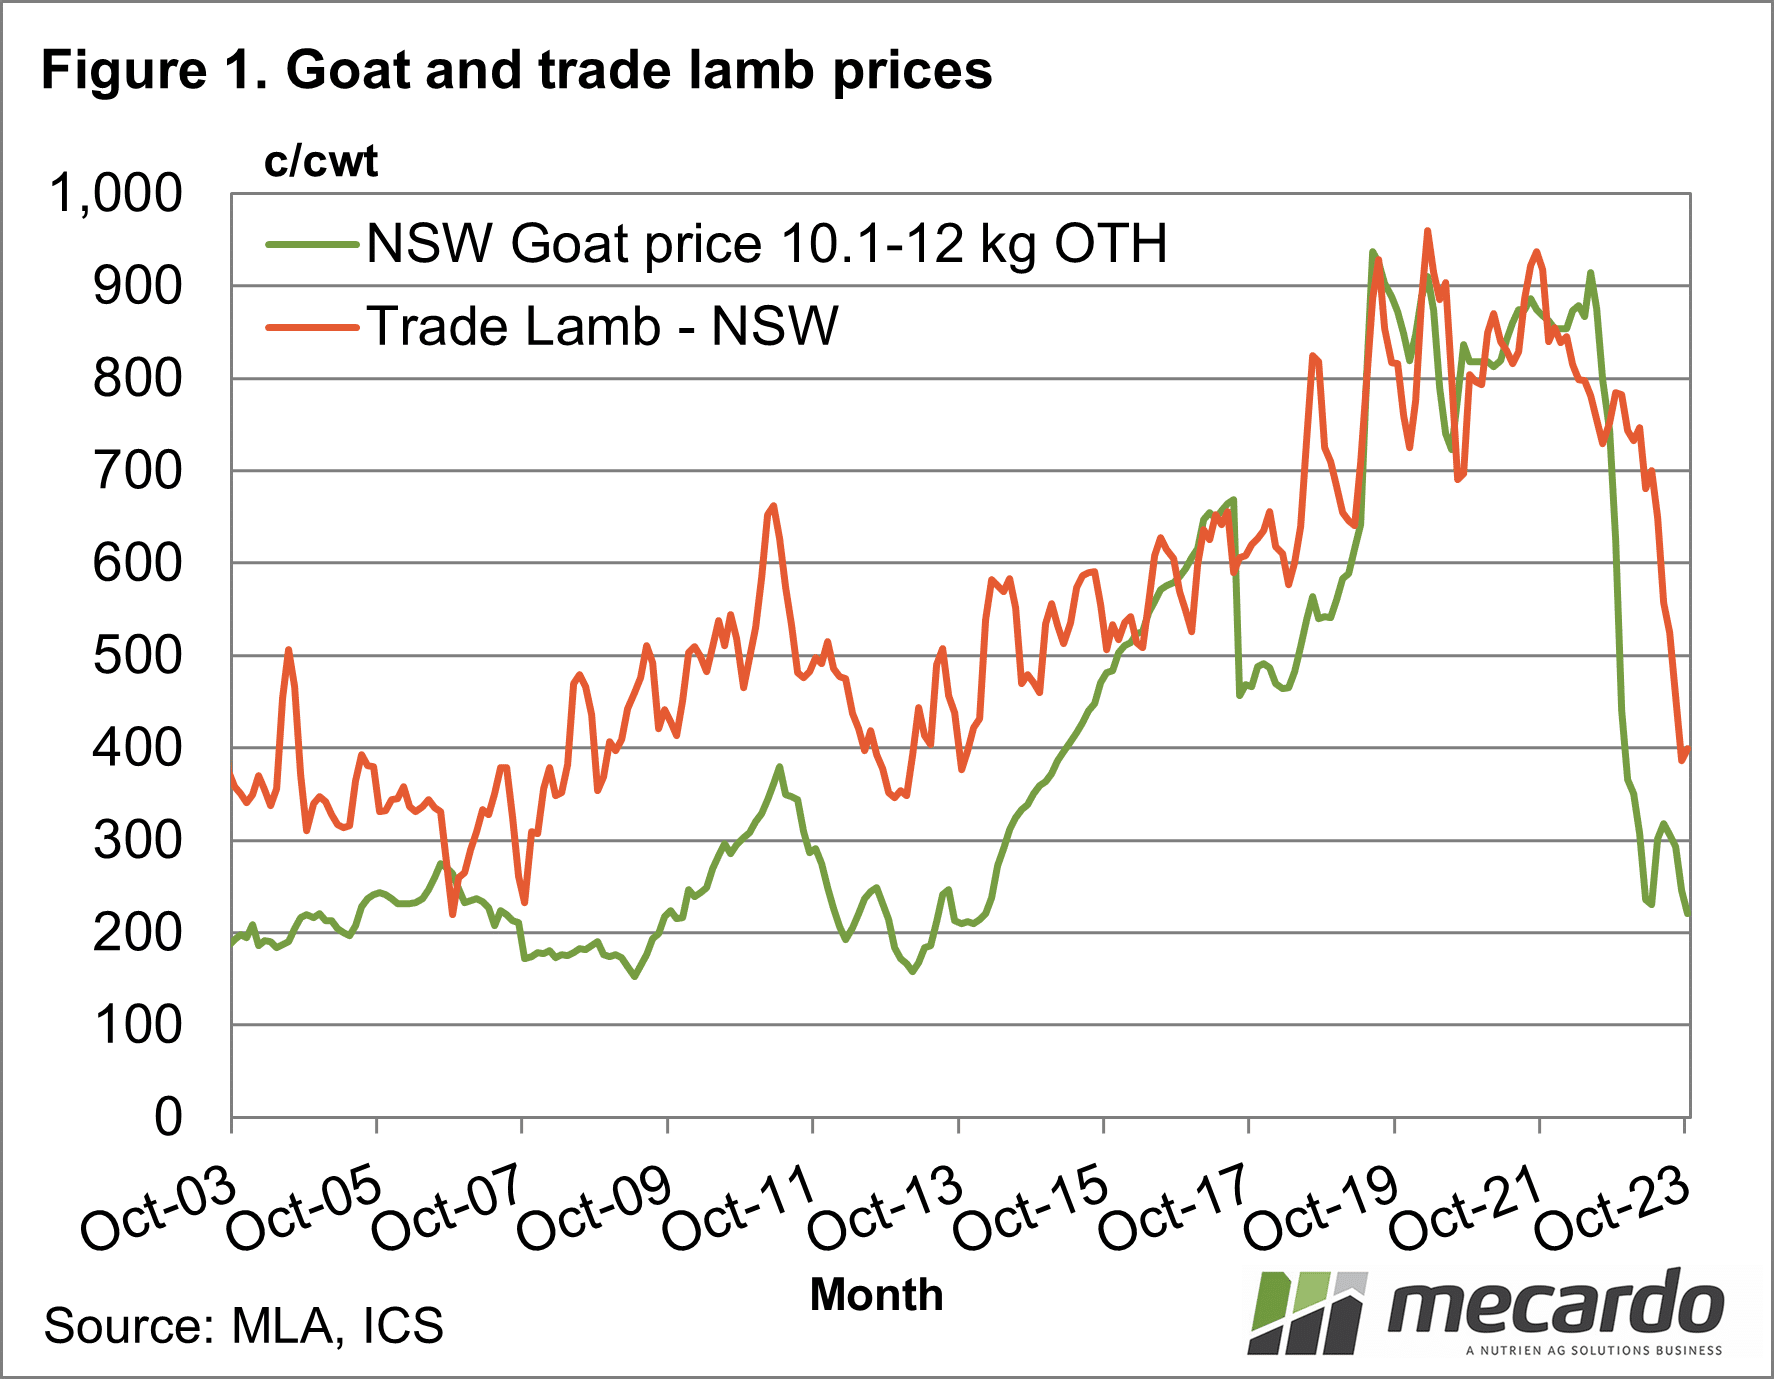
Figure 1 is a simple comparison of a price series for goat and NSW trade lamb from 2003 to last month. Up until 2015, goats traded at a sizeable discount to lamb. From 2015 it then tended to trade close to the lamb price until late 2022 when a large discount opened up again. However, the cycles and trends seen in the lamb price are reflected in the goat meat price. The two series are highly, positively correlated (across the two decades a correlation of 0.79) with a varying basis or difference in price.
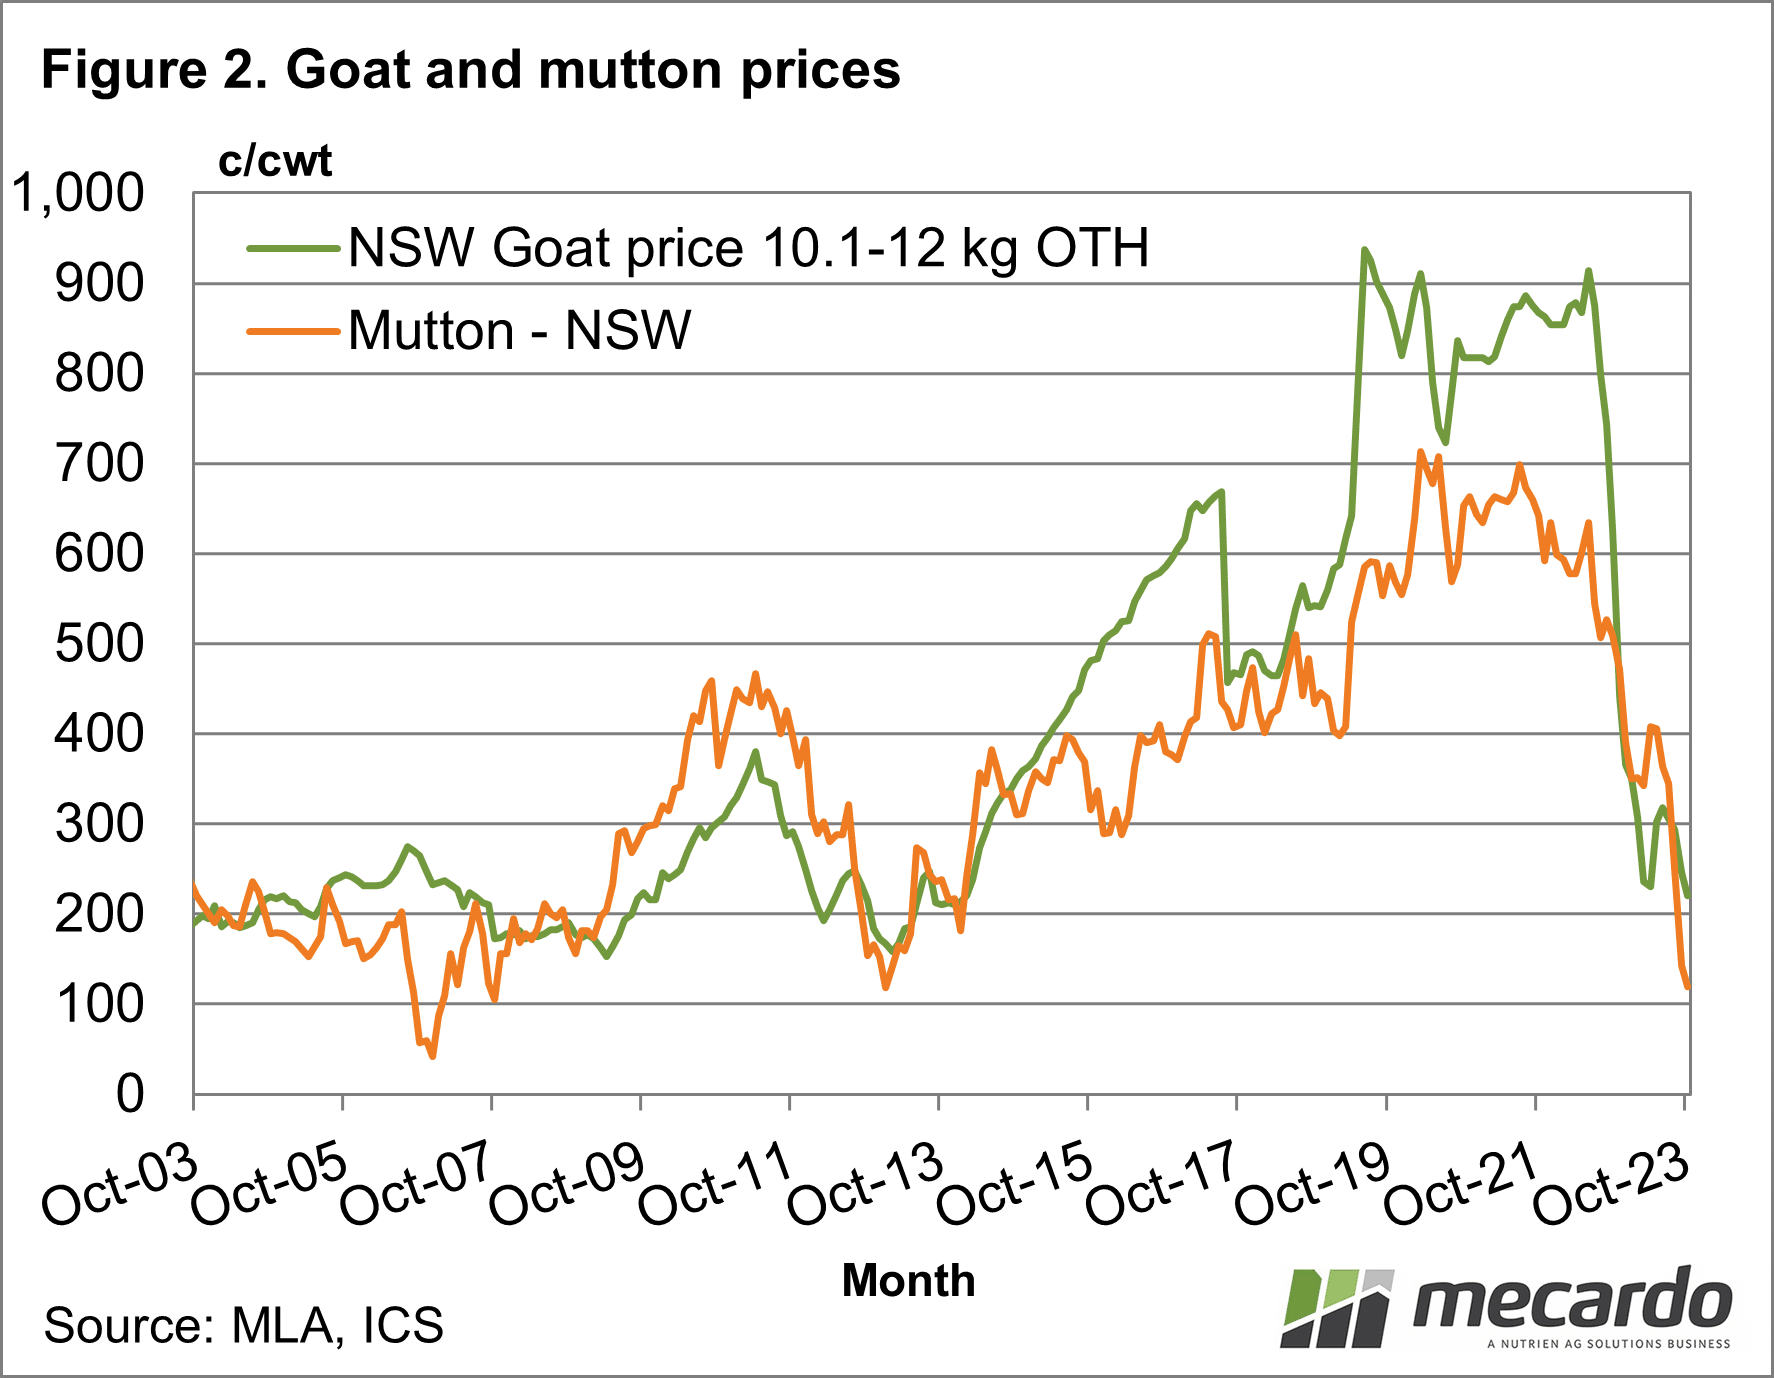
In Figure 2, the exercise is repeated with mutton in place of lamb. In this case, the goat price follows mutton closely from 2003 to around 2015, at which point goat lifts to a sizeable premium to mutton. In late 2022 the goat price gives up the premium and heads back to trading at the mutton price level. The story is similar to Figure 1 in that goat and mutton prices are highly positively correlated, with a varying basis or difference.
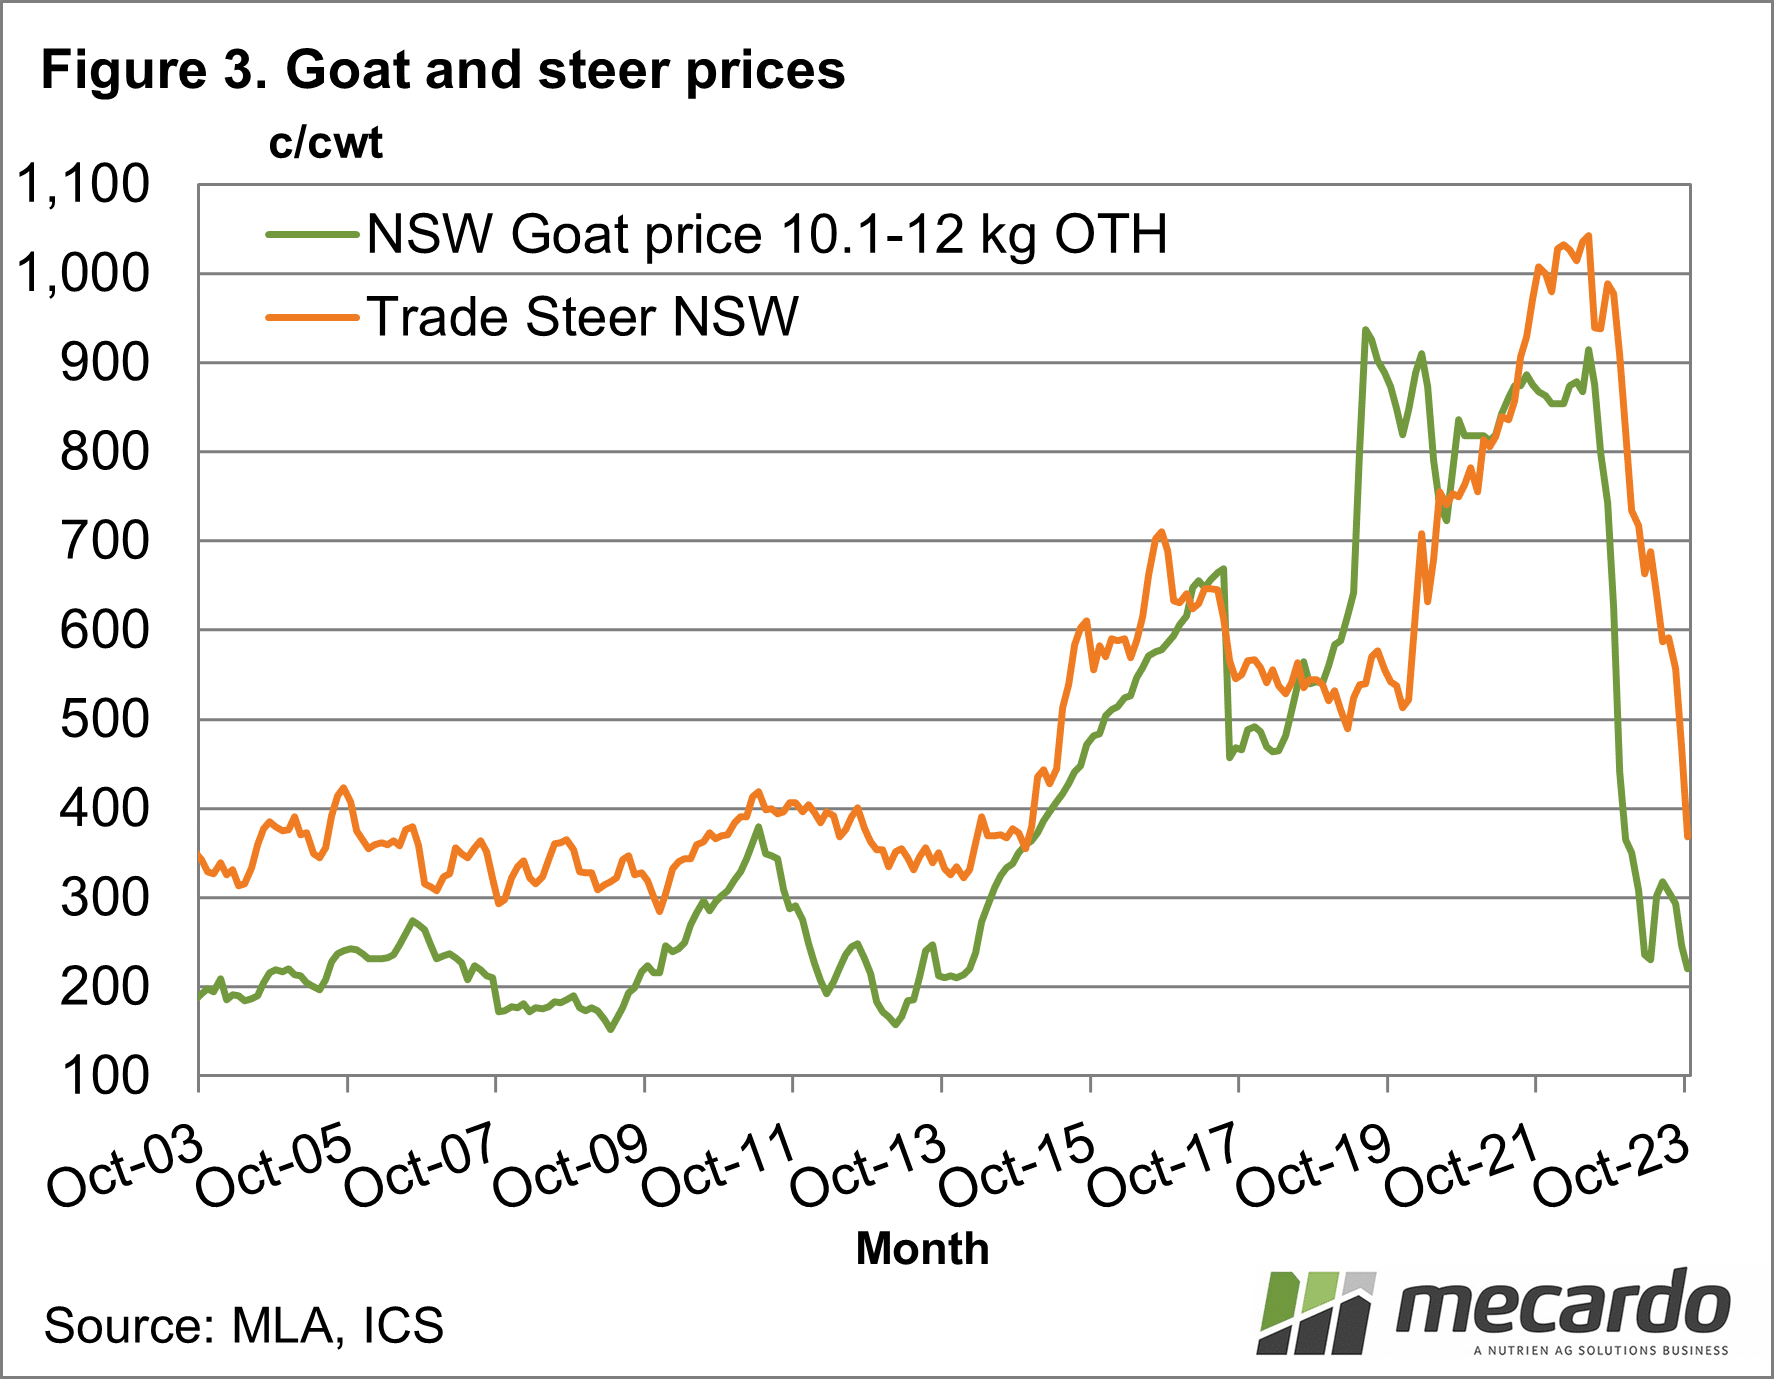
In Figure 3, the NSW Goat price is compared to the NSW trade steer price. The correlation drops away slightly (it is still 0.73 for the two decades) but the major trends seen in goat prices are reflected in the beef price series.
So, what does this mean? If you are producing goat meat, in terms of price risk the history of recent decades says that goat prices will follow the sheep meat prices, varying between mutton and lamb price levels.
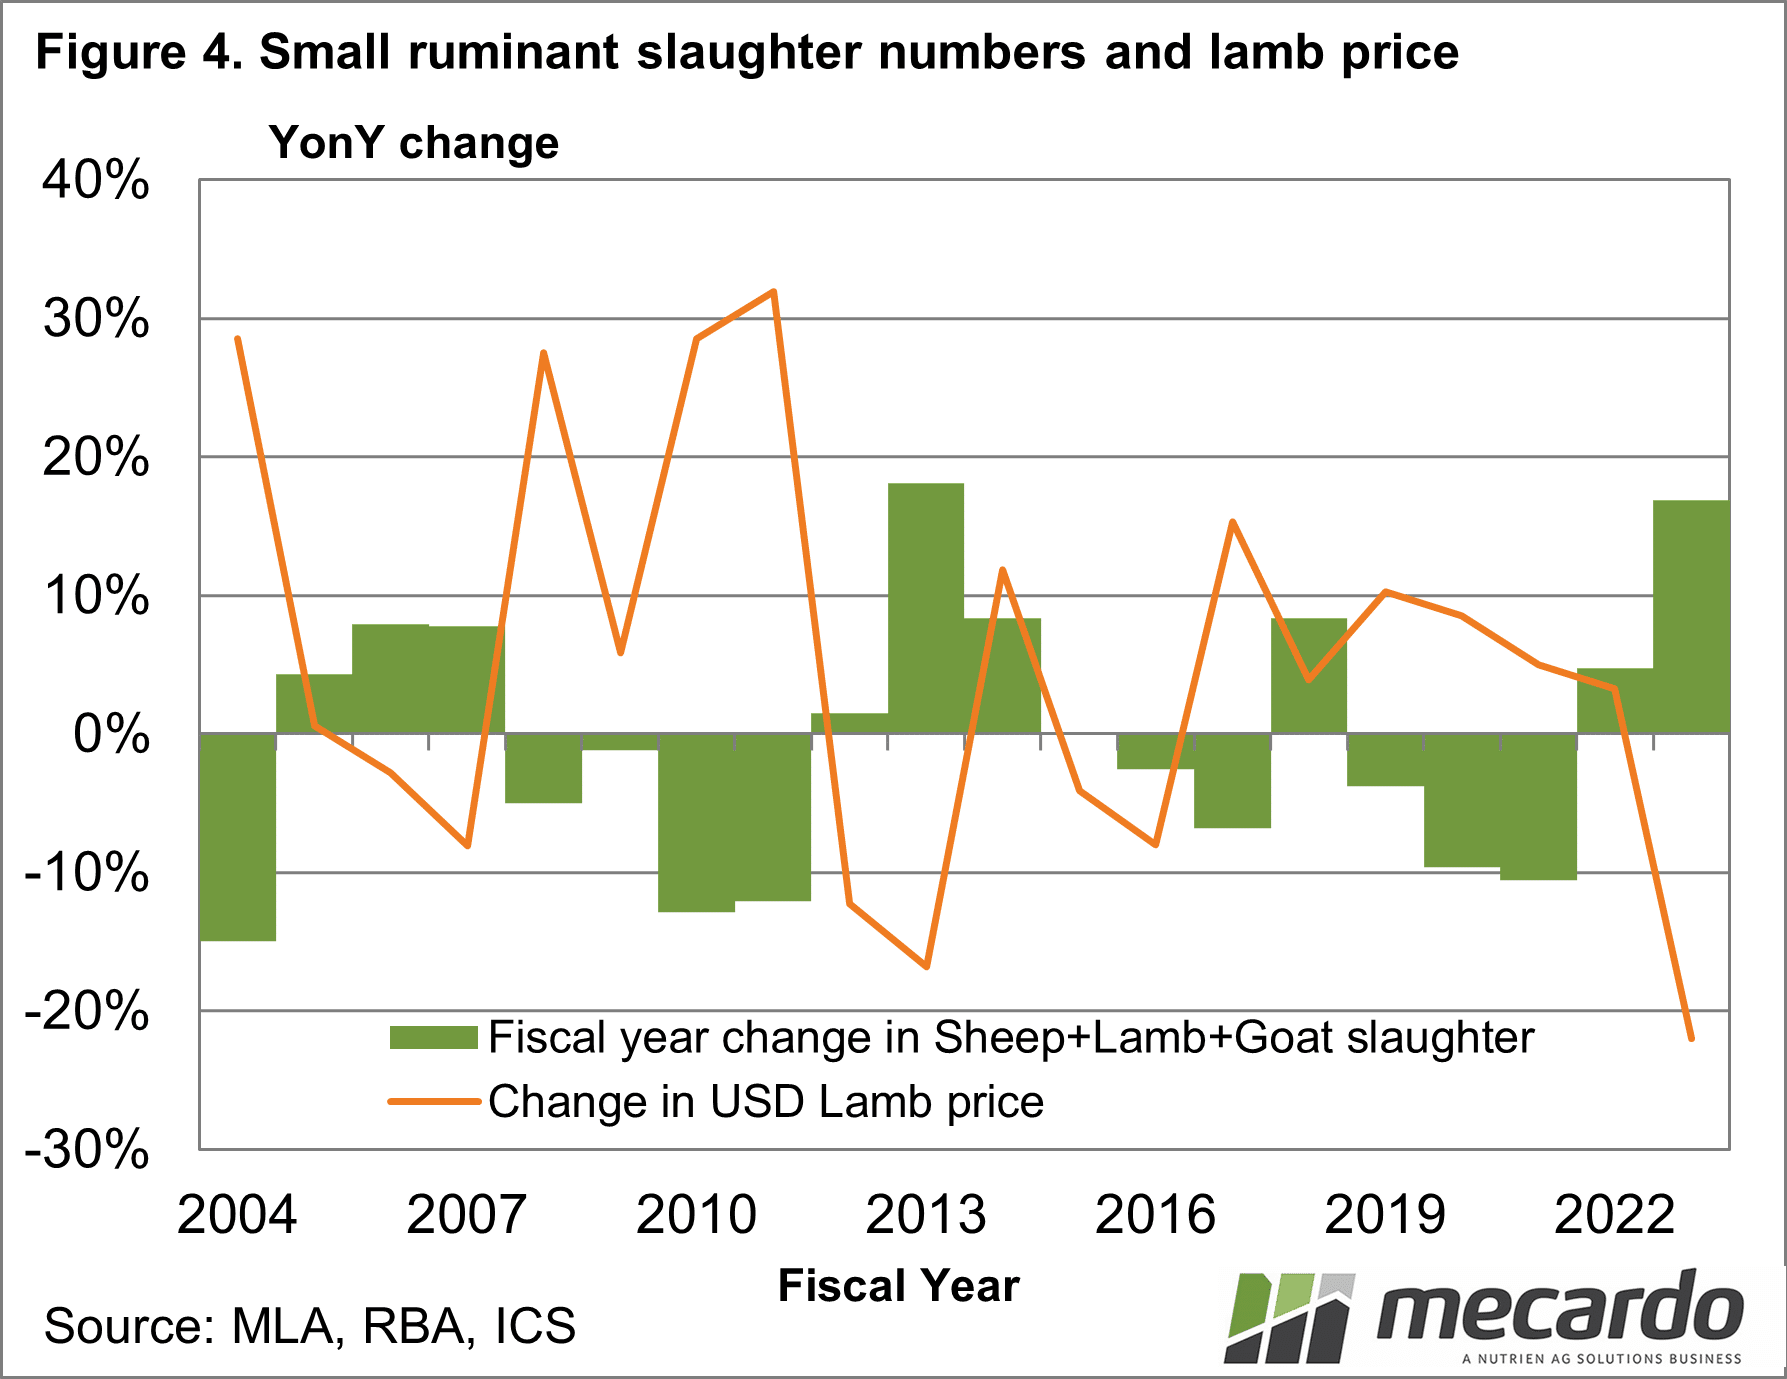
Supply plays a major role in price variation from year to year. Figure 4 shows the year-on-year variation in the number of sheep, lambs, and goats (small ruminants) slaughtered in Australia during the past two decades and the change in the lamb price, in US dollar terms. Some 60% of the year-on-year change in the US dollar value of the lamb price is explained by the change in small ruminant slaughter numbers, which tends to be driven by changing seasonal conditions. Seasonal conditions impact all species, pushing flows of stock off the farm up and down which impacts price. That mechanism has played a big role in the recent downturn in meat prices.

What does it mean?
Meat prices for different species generally are positively correlated, although circumstances can break the correlation (sheep flock liquidation in the early 1990s for example). Seasonal conditions are a major driver of change in supply from year to year which in turn are a major driver of year-on-year price changes. Seasonal conditions apply across all species, which helps explain why cycles (such as the down cycle playing out now) are similar across extensively grown meats.
Have any questions or comments?

Key Points
- Goat meat prices vary between mutton on the low side (where they are now) and lamb on the high side (2015-2022).
- Small ruminant, extensively grown, meat prices are highly positively correlated albeit with varying differences in price.
- Changes in seasonal conditions drive change in off-farm sales (to abattoirs) which in turn impacts price.
Click on figure to expand
Click on figure to expand
Click on figure to expand
Click on figure to expand
Data sources: MLA, RBA, ICS, Mecardo