Beef prices down 50% on recent highs, lamb down 56%, and merino wool down 40% on 2018 highs are not a welcome combination. This article looks at the past 50 years to put these down cycles in a historical context.
Every commodity price cycle or price trend varies in some way, as the saying goes “History does not necessarily repeat but rhymes”. One way of looking at price movements is to measure the range from trough to peak (rises) and peak to trough (falls), without going into the minutiae of what has driven the particular price cycle, without being an expert in the particular commodity being reviewed if you like. The other saying for commodities, about how “prices tend to halve and double” fits neatly into this sort of analysis.
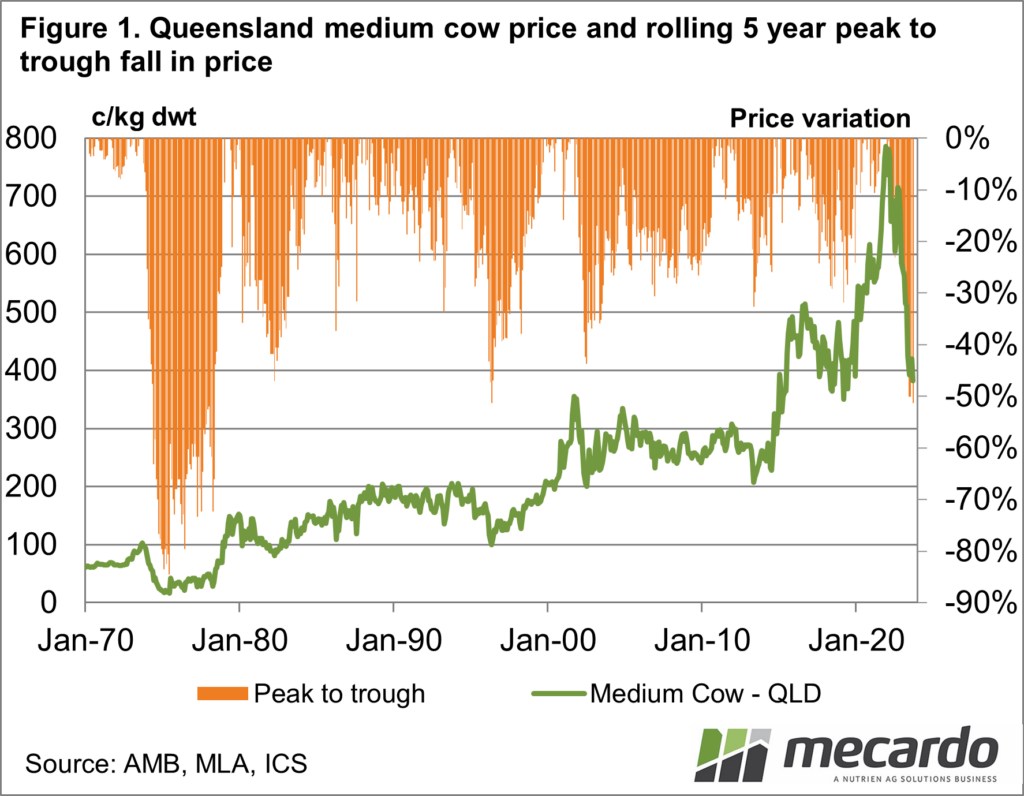
To begin with, Figure 1 shows a Queensland medium cow price series from 1970 to now, in nominal Australian cents per kg terms. Nominal is used in this instance as we are interested in the peak-to-trough fall in price, shown by the red bars rather than comparing the price series across time. The peak-to-trough bars show the rolling change in price compared to the highest price level of the preceding five years. The choice of five years is subjective.
In Figure 1 the price is currently down 50% on recent peak levels, which matches or exceeds most of the falls in price seen since the mid-1970s. Nothing matches or comes close to the disastrous mid-1970s when prices were down 70-80% on the 1973 peak levels. This series is for finished cattle so a store price series would probably show even larger falls at the time.
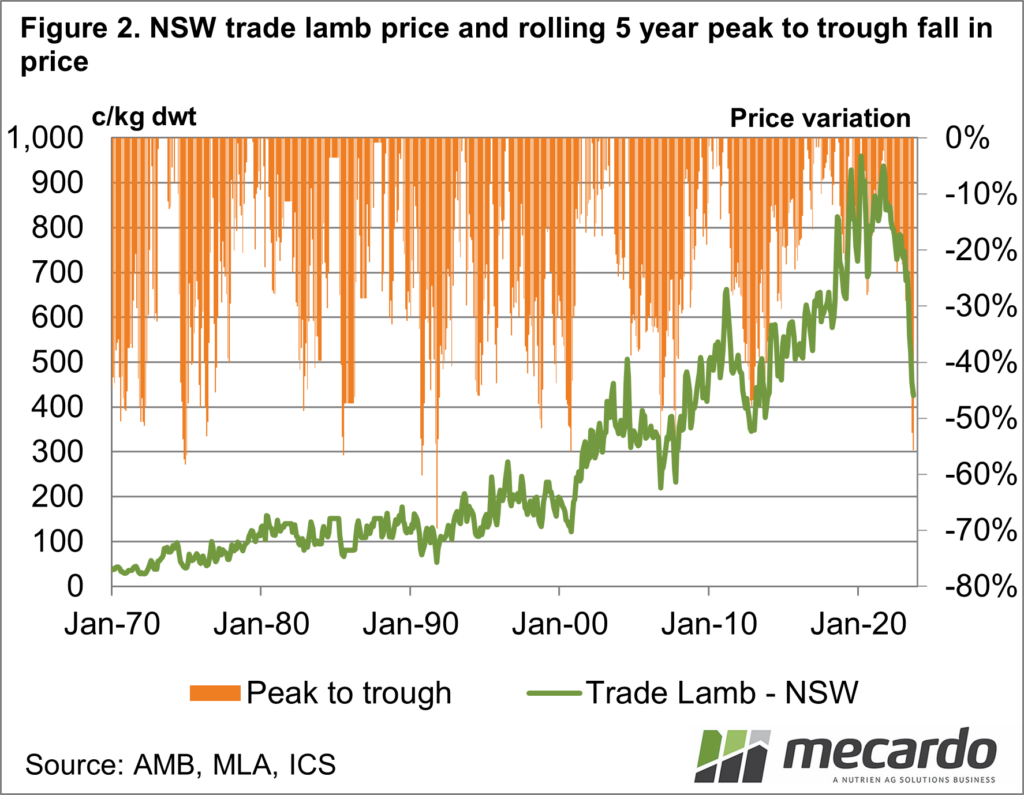
Figure 2 repeats the exercise for an NSW trade lamb sale yard price series. The current price is down some 56% on recent peak levels, about the tenth time the lamb market has done this since 1970. One of the key differences this time is that it is 11 years since the last such fall in price and since then the lamb prices have enjoyed a strong uptrend in price. The strong uptrend in the lamb price really began around 2000 and has a strong negative correlation with the combined decline in sheep meat (lamb and mutton) in key developed countries such as New Zealand, the USA, the UK, Europe, and Australia, with Australia bucking the trend on its own but not enough to offset the combined decline.
Usually, the lamb price rebounds between 25% and 50% of such a big peak-to-trough decline relatively quickly, so the prospects for 2024 look appreciably better than they do currently.
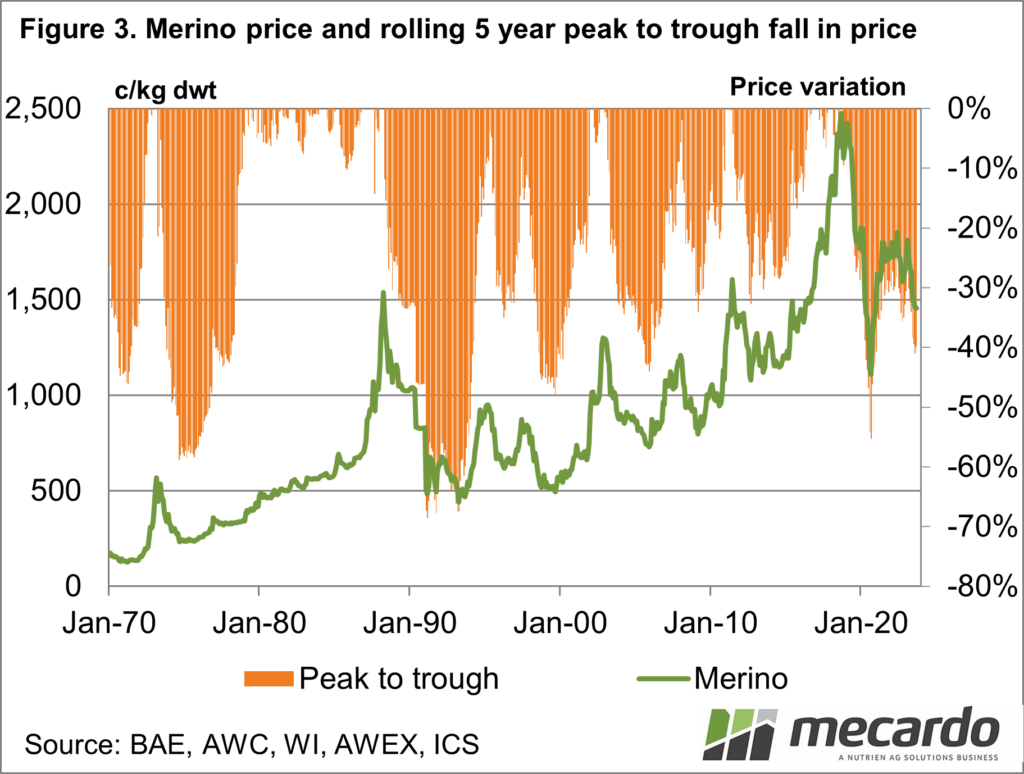
To round out the commodities, Figure 3 looks at the peak-to-trough falls in the merino (average micron) price. The current market is down some 40% on 2018 peak levels which is substantial but appreciably less than the mid-1970 and early 1991 (post Reserve Price Scheme collapse) falls. In the period from the late 1970s to 1987 (the height of the RPS) there was little downward movement in price due largely to the exchange rate. In US dollars it is a different story.
What does it mean?
The extensive commodities produced on Australian farms remain commodities, with all of the price variability that entails. High prices reached in the post-eastern drought period of 2020-2021 have accentuated the size of the price fall seen since late 2021. History indicates the lamb price should recapture 25-50% of its fall in a reasonably short space of time.
Have any questions or comments?
Key Points
- While individually the three commodities (beef, lamb, and merino wool) have had plenty of serious falls in price during the past 50 years, the current downturn is second only to the mid-1970s.
- For lamb this is the tenth fall in the order of 50% (peak to trough) since 1970.
- Lamb usually recovers 25-50% of the fall reasonably quickly.
Click on figure to expand
Click on figure to expand
Click on figure to expand
Data sources: AMB, MLA, BAE, AWC, WI, AWEX, ICS, Mecardo


