
With Melbourne auction sales limited for a large part of 2020 (to two sale days and a limited number of lots per sale room per sale day) because of COVID-19 restrictions in tandem with reduced demand again because of COVID-19 the volume of wool sold at auction has been below production levels. In light of this Mecardo takes a look at farmer held stocks in Australia.
The simplest way of quantifying farmer held stocks in Australia would be to count the farm bales in sheds and stores. Unfortunately this is not done. In the absence of such greasy stock information there are a couple of ways of assessing the level of stocks, keeping in mind that such methods are imperfect in that they do not capture on farm stocks nor off-auction sales.
The simplest way of assessing greasy stock levels is to look at the difference between AWTA core test volumes and auction sale volumes. AWTA volumes line up very well (with one wobbly period between 2016 and 2018) with the Australian Bureau of Statistics census of wool receivals into store, so the AWTA data is a good measure of the volume of wool flowing into wool broker stores. Wool held back on farm will not be captured by this method.
Figure 1 shows annual sales of greasy wool in Australia as a proportion AWTA core test volumes by wool selling season. Looking back over the past 10-12 years it appears that auction sales average around 85% of AWTA volumes. Given that average, it is assumed that when the ratio is below 85% stocks are building and when the ratio is above 85% stocks are being reduced. The four seasons ending in 2017-2018 was a period of solid sales, which makes sense as wool prices were high and rising. From 2018-29 the ratio falls away which fits with the view of apparel fibre prices falling from mid-2018, which we looked at last week (view article here).
The ratio plunged to 72.8% in 2019-2020 when prices crashed firstly in the spring of 2019 and then crashed again in the autumn of 2020 as the effect of COVID-19 became felt in the wool market. For the current season the ratio is running at 79%, implying that we are building stocks at the rate of 6% of production.
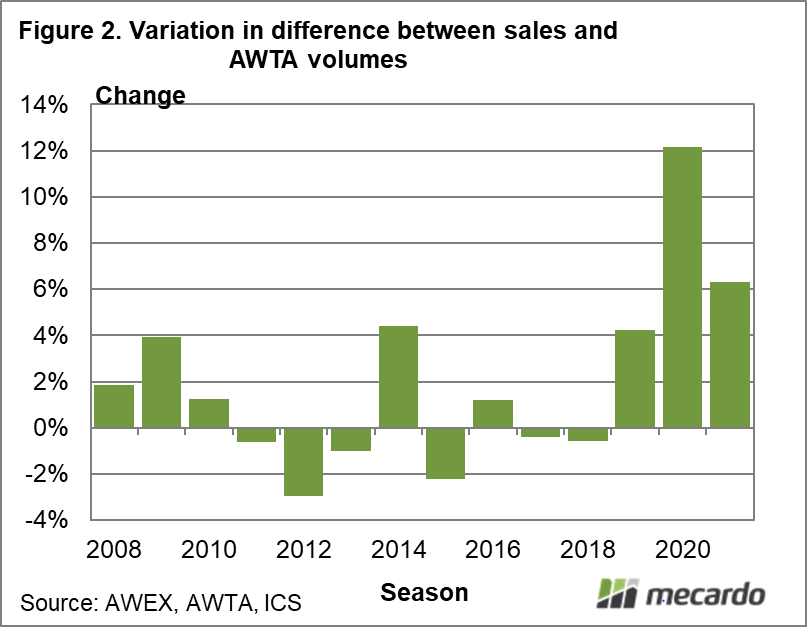
Wool broker feedback indicates that grower stocks on hold reached a minimum in mid-2018, at the peak of the apparel fibre price cycle. Using that piece of information we can use the data from Figure 1 to develop an estimate of farmer held stocks in Australia. In Figure 2 the variation in the ratio shown in Figure 1 from a level of 85% is shown. Keep in mind the current season is an estimate for the full season although we are not yet half way through it.
Since mid-2018 sales have been below AWTA volumes by 4% (2018-19), 12% (2019-20) with the current season running at 6% below (2020-21). A simplified view of the current cumulative stock level is to add these up, totalling to 22-23% at the end of the current season. Given the AWTA volume for last season was 1.65 million bales, a stock level of 22-23% would total 360,000 farm bales. Stocks are not at this level yet. They are more likely in the 250-320,000 farm bale range currently.

What does it mean?
Given the strong cash flows enjoyed by many farmers in 2020, the consistent feedback is that farmers are happy to hold greasy wool stocks for some time. In light of the severe drop in demand out of Europe and North America this is a logical strategy. Stock levels expressed as a proportion of production remain well below the massive levels existing in the cotton industry. Given the low levels of stock reported along the supply chain, when demand does start to crank back up, a sizeable proportion of farmer held stocks will be required to re-stock the supply chain.
Have any questions or comments?
Key Points
- Wool stocks held by growers have picked up since mid-2018 in response to lower prices.
- While current stocks are likely in the range of 250-320,000 farm bales, if current trends continue they are likely to end up close to 360,000 bales in mid-2021.
- This would put stocks at 22-23% of annual shorn wool production.

Click on graph to expand
Click on graph to expand
Data sources: AWEX, AWTA, ICS, Mecardo.


