Wool is essentially a feedstock for an industrial process, with fashion tacked on the end of the supply chain. That is not how the marketers portray things however wool prices cycle and trend along with industrial commodities, in particular apparel fibres.
A tour through a topmaking plant and then through a spinner to a weaver is quite a journey, worthwhile for woolgrowers and anyone associated with growing or selling wool to do a number of times. It puts the industrial nature of the business into better perspective. With this in mind, the work done by the AWC and CSIRO in the 1970s through to the 1990s in developing objective measurements and then relating these measurements to measurable outcomes at various processing stages was a wise investment. The raw wool measurements allowed for more efficient processing.
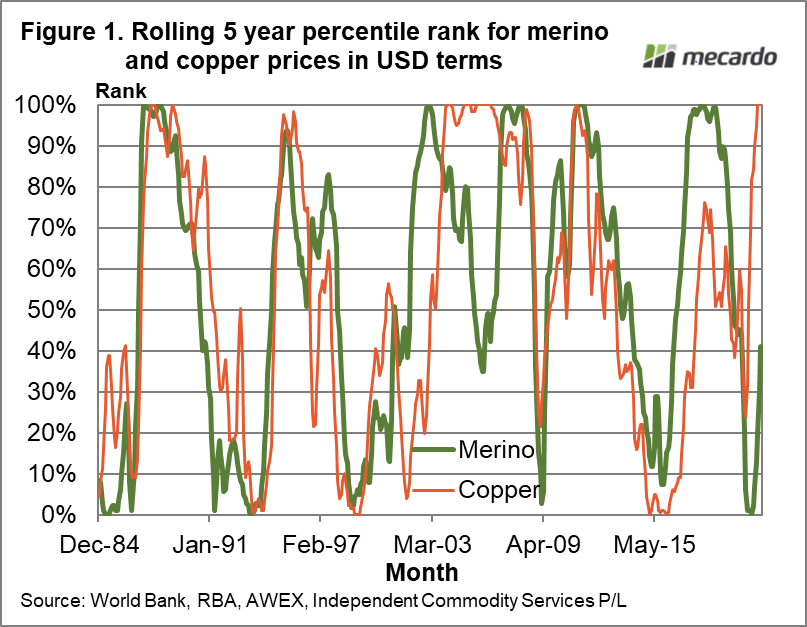
As an example of how wool prices move in line with industrial commodity prices Figure 1 compares rolling five-year percentiles for the average merino micron price (merino) and copper. The schematic runs from 1984 to this month. Percentile ranks allow a direct comparison between prices for two totally different commodities. It shows a high degree of similarity in terms of cycles between copper and merino price ranks. They occasionally get out of line such as in 2002 when wool prices went through their standard post stockpile rising price cycle, where prices will typically rise by around 150% from the previous cyclical low. The 2018 cycle was not as strong for copper as it was for merino prices, and now copper prices have rebounded more strongly out of the 2020 COVID-19 instigated low.
Closer to home in terms of commodities Figure 2 compares merino and cotton prices for the same period, in the same manner as Figure 1. As with copper, the relationship between merino and cotton is very good, occasionally getting out of alignment. Cotton had a comparable 2018 price cycle to merino, and like copper has rebounded more strongly since the lows of 2020.
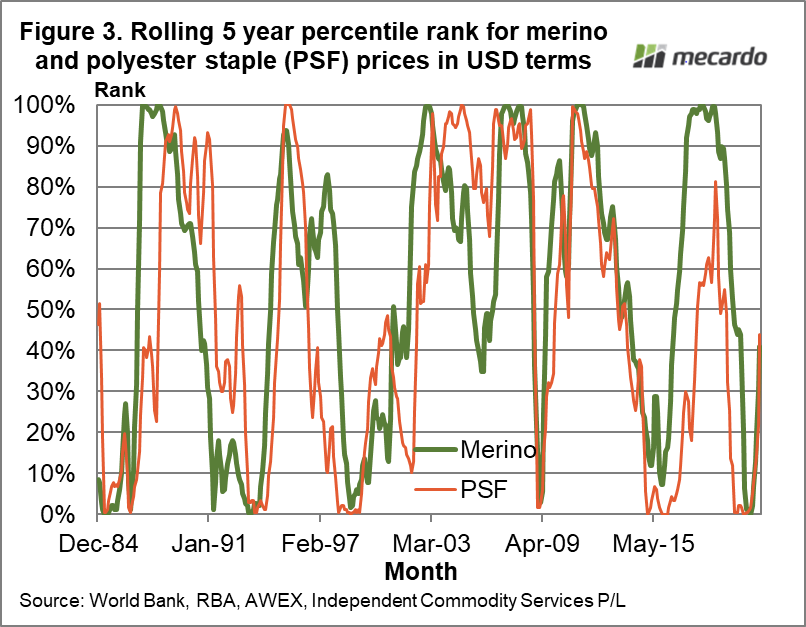
Figure 3 repeats the process with polyester staple fibre (PSF). It is a similar story, with the two series occasionally getting out of alignment but at different periods to the earlier comparisons. The rebound of PSF out of the 2020 lows is on par with the performance of merino.
The message of this article is that wool prices should not be considered in isolation. A natural instinct is to consider the goings-on in the wool market such as changes in supply and assume these are driving prices. This is certainly true of relative prices within the wool market and between the wool market and other apparel fibres, but the overall price cycle and trends of the raw wool market are set by the greater economies of the world which are reflected in industrial commodity prices.
What does it mean?
For grower returns here and now, price is price. However, when considering how well the market is travelling, allowance needs to be made for the outside world, in this case, the general level of industrial commodity prices. This may seem an obscure point to make but it was the root cause of the collapse of the Reserve Price Scheme in 1988-1991 when advice from in house economists taking into account the elevated nature of commodity prices, with the attendant risk they might fall taking wool prices with them, was ignored.
Have any questions or comments?
Key Points
- Wool is an industrial commodity and its price follows the path of industrial commodities generally.
- As an example of this, the merino and copper rolling price percentiles have a strong positive correlation.
- The current recovery in the average merino price from the lows of last spring is on par with polyester staple but lower than for cotton and copper.
Click on figure to expand
Click on figure to expand
Click on figure to expand
Data sources: World Bank, RBA, AWEX, ICS, Mecardo


